PSYCH 3090 Lecture Notes - Lecture 5: Normal Distribution, Psych, Standard Deviation

Document Summary
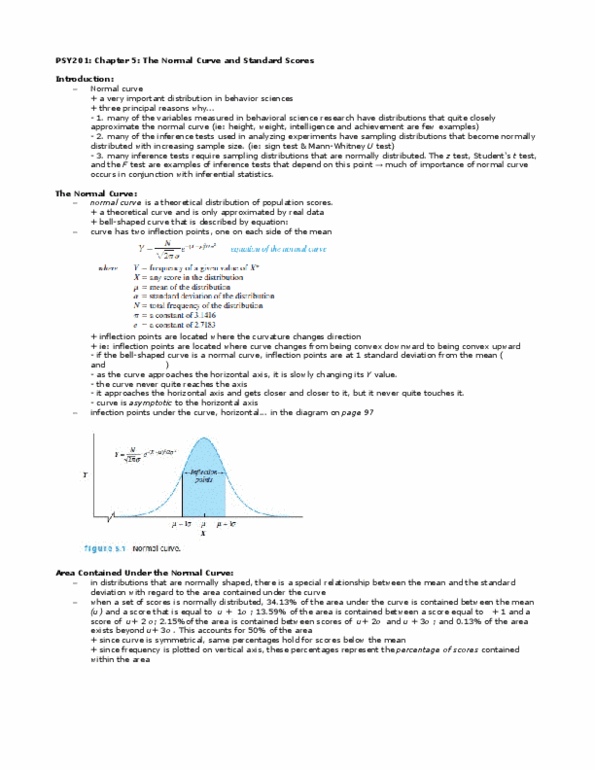
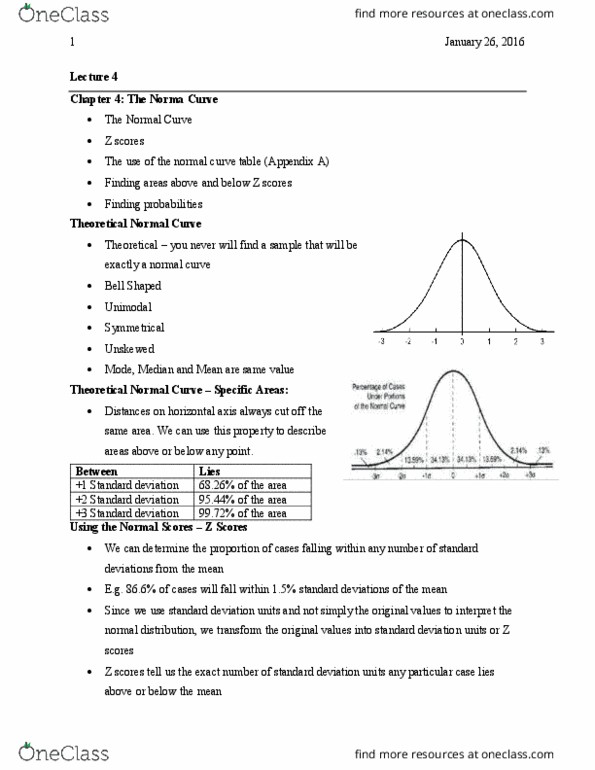
Standard scores and normal curve: normal curve refers to a family of curves, bell-shaped, symmetric, unimodal, continuous, area under any normal curve sums to 1. 0. Between 0 and 1 is 0. 3413 (area % = 34. 13%) Between 1 and 2 is 0. 1359 (area % = 13. 59%) Between 2 or greater is 0. 0228 (area % = 2. 28%) Between -1 and 1 is 0. 6826 (area % = 68. 26%) Between -2 and 3 is 0. 9544 (area % = 95. 44%) Standard score and normal curve: given a z score o z= y y. Y = y +z y: z-table found in appendix table a, we can convert a set of scores to have any mean or standard deviation. It is known that cognitive ability scores follow a normal curve with = 100 and = 15. What if we wanted to know the proportion of individuals with a cognitive ability score greater than 130: z = 130 z= 130 100 o.