STAT 301 Lecture Notes - Analysis Of Variance, F-Test

Document Summary
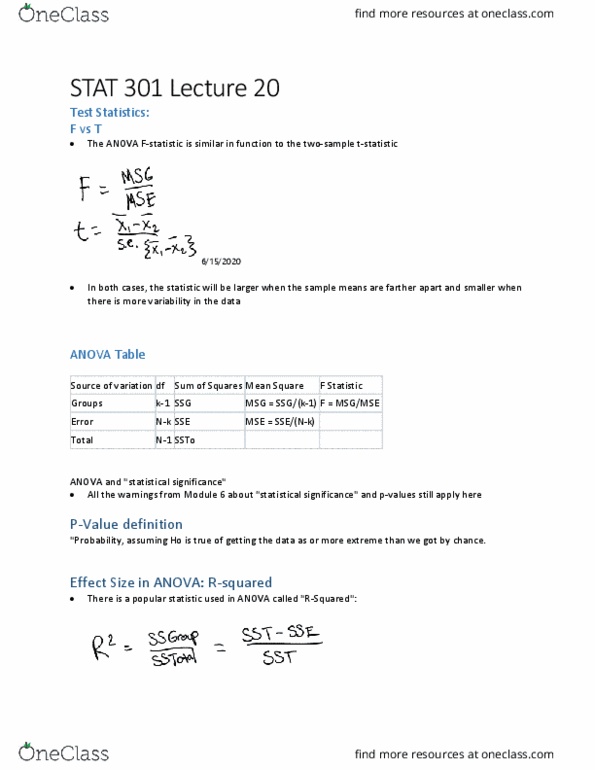
Anova allows us to compare more than two means. In case 1, we want to know if the differences in sample means can plausibly be attributed to true differences in 1, 2, and 3. Case 2 could be a sample from the same population used in case 1. If true, we are trying to protect against odd samples like in case 1. Variability between populations indicates true differences in . H0: 1 = 2 = = k. Ha: at least one i differs (at least two are different) Each of the k populations have normal distribution. Ssm also called ssbetween, measures disparity between sample means. X )2 + + nk( xk. Where x = ni xi n i=1 n i=1 ni. Sse also called sswithin, as it measures disparity within samples. Tss = ssm + sse = (ni 1) si. Each ss has an associated degrees of freedom. Msm and mse are statistics, so they have their own sampling distributions.