STAT 301 Lecture Notes - Probability Plot, Scatter Plot, Sampling Distribution

Document Summary
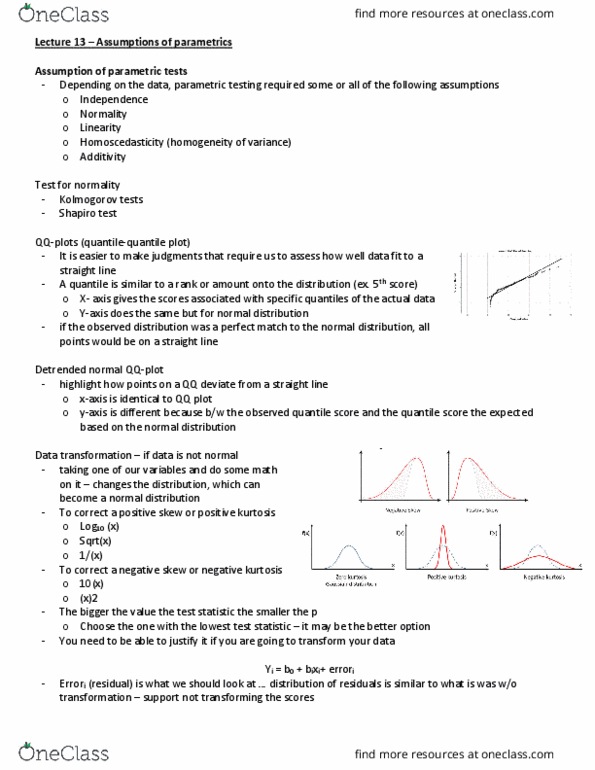
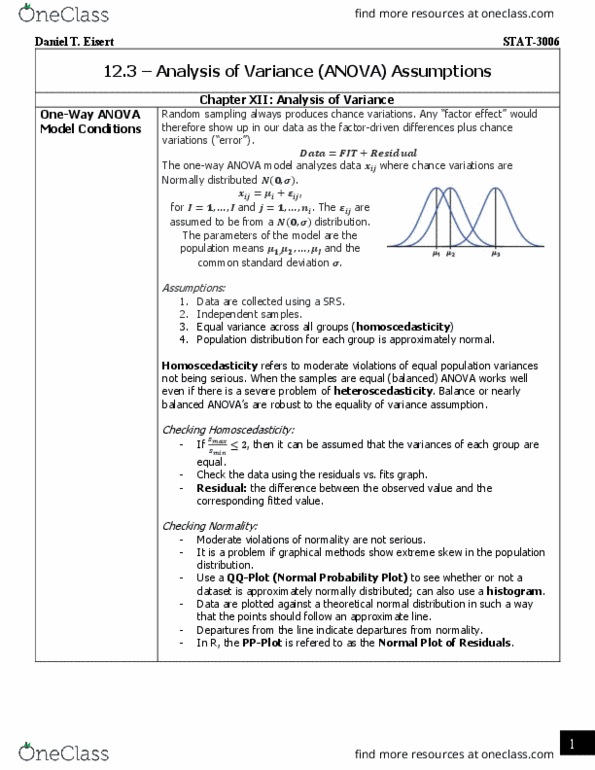
We can check a normal distribution assumption with the use of a normal probability plot (q-q plot) A scatterplot of the (normal score, observation) pairs. A normal score is what we expect the value of the observation to be if it truly came from a normal distribution. A substantial linear pattern suggests that population normality is plausible. Points falling outside the bands are warnings of possible non-normality (when bands are used) If we have non-normal data, we can try to transform the data so that it is approximately normal. Then we can apply statistical methods used for normal data to the transformed data. Log (x) (base 10 or base e, usually base e unless otherwise stated) So if the data is not normal, try a transformation to see if the transformed data is normal. If it is, we can then use the normal tables to find probabilities involving the transformed data. The statistics will vary from sample to sample.