STS 110 Lecture Notes - Lecture 7: Catskill High Peaks, Skewness, Standard Deviation

20 Feb 2018
School
Department
Course
Professor
Document Summary
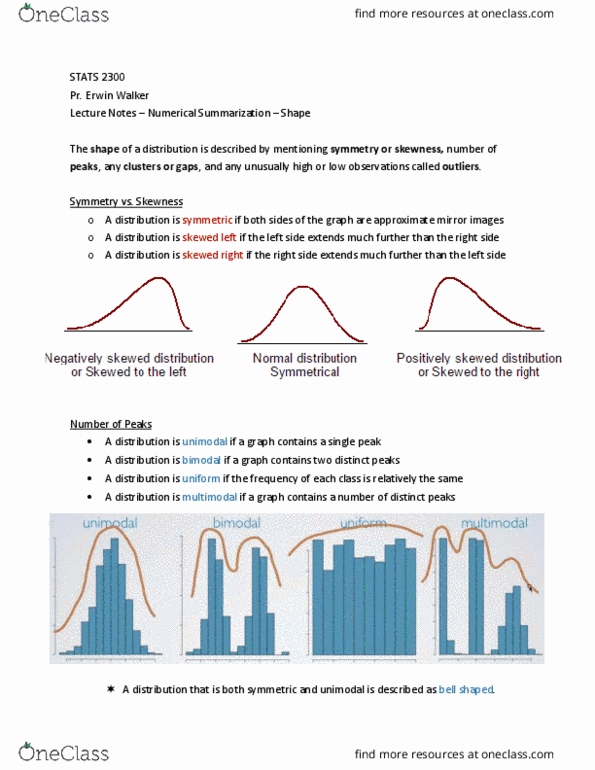
All peaks are considered modes even if they have di erent heights. The mode is located on the x-axis and is a value from the data set. The left side of the graph is a mirror image of the right side of the graph. A graph is skewed if data is clustered on one side. Indicates how spread out the data set is. Low variation (steepness is high, variation is low) High variation (steepness is low, variation is high) Bank #1 has customers wait in di erent lines for a speci c teller. Sample of waiting times (min): 4. 1, 5. 2, 5. 6, 6. 2, 6. 7, 7. 2, 7. 7, 7. 7, 8. 5, Bank #2 has customers wait in a single line or the next available teller. Sample of waiting times (min): 6. 6, 6. 7, 6. 7, 6. 9, 7. 1, 7. 2, 7. 3, 7. 4, 7. 7, Mean and median do not give an indication of variation. We will use range and standard deviation to measure spread.