PCB 4043 Lecture Notes - Lecture 4: Carrying Capacity, Ecological Footprint, Exponential Growth

30 May 2016
School
Department
Course
Professor
Document Summary
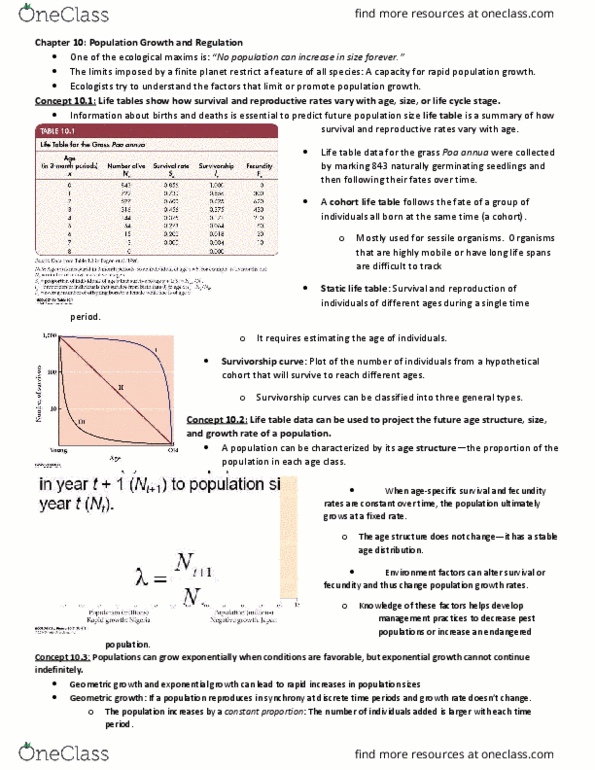
10. 1- life tables show how survival and reproductive rates vary with age, size or life cycle stage. A life table gives info about births and death is essential to predict future population size: it can sometimes be very hard to measure the age of an organism, so it can also go by size. Life table: summary of how survival and reproduction rates vary with age. Cohort life table: follows the fate of a group of individuals all born at the same time (a cohort: can be pretty difficult to track for mobile organisms- typically used for sessile organisms. Static life table: survival and reproduction of individuals of different ages during a single time period: requires estimating the age of individuals. Survivorship curve: plot the number of individuals from a hypothetical cohort that will survive to reach different ages: 3 general types of survivorship curves. I- pretty high survival until you get really old and then it starts to drop off.