ECON-002 Lecture Notes - Lecture 15: Excess Reserves, Memory Stick, Money Supply

Document Summary
Get access


Related Documents
Related Questions
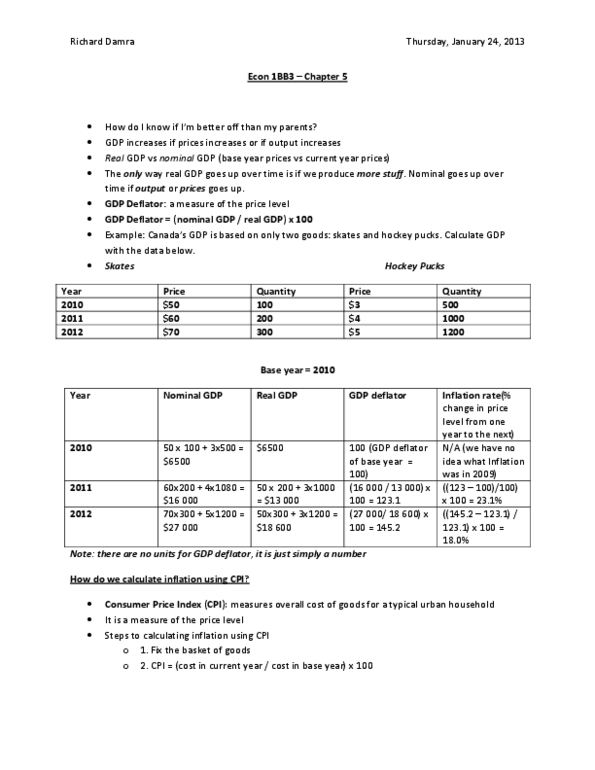
Consider an economy that produces and consumes bread and automobilies , In the following table are data for two different years
| YEAR 2000 | YEAR 2000 | YEAR 2010 | YEAR 2010 | |
| GOOD | QUANTITY | PRICE | QUANTITY | PRICE |
| AUTOMOBILES | 100 | $50000 | 120 | $60.000 |
| BREAD | 500.000 | $10 | 400.000 | $20 |
a)Using the year 2000 as the base year ,compute the following statistics for each year : nominal GDP ,real GDP ,the implicit price deflator for GDP ,and a fixed-weight price index such as the CPI
b)How much have prices risen between 2000 and 2010? Compare the answers given by the Laspeyres and Paasche price indexes. Explain the difference
c) Supopose you are a senator writing a bill to index Social Sewcurity and federal pensions. That is ,yout bill will adjust these benefits to offset changes in the cost of living. Will you use the GDP deflator or the CPI? Why?
The table below lists annual consumer price index and inflation rates for a country over the period 2005-2010. Assume the year 2005 is used as the base year.
| Year | Consumer Price Index | Inflation Rate |
| 2005 | 100 | |
| 2006 | 115 | B |
| 2007 | 125 | C |
| 2008 | 140 | D |
| 2009 | A | 10% |
| 2010 | 160 | E |
| |||
| 120 | |||
| |||
|
The price index was 170 in the first year, 180 in the second year, and 195 in the third year. The inflation rate was about
| |||
| |||
| |||
|
0.1 points
QUESTION 17
The price index was 150 in the first year, 142.5 in the second year, and 138.2 in the third year. The economy experienced
| 5.0 percent deflation between the first and second years, and 3.0 percent deflation between the second and third years. | ||
| 7.5 percent deflation between the first and second years, and 4.3 percent deflation between the second and third years. | ||
| 5.3 percent inflation between the first and second years, and 4.1 percent inflation between the second and third years. | ||
| 7.5 percent inflation between the first and second years, and 4.3 percent inflation between the second and third years |
0.1 points
QUESTION 18
Which of the following statements is correct about the relationship between the nominal interest rate and the real interest rate?
| |||
| |||
| |||
|
0.1 points
QUESTION 19
If the nominal interest rate is 6 percent and the rate of inflation is 2 percent, then the real interest rate is
| |||
| |||
| |||
|
0.1 points
QUESTION 20
If the nominal interest rate is 7 percent and the real interest rate is -2.5 percent, then the inflation rate is
| 9.5 percent. | |||
| |||
| |||
|
. From 2009 to 2010, the CPI for education increased from 279.3 to 281.8. What was the inflation rate for education between 2009 and 2010?
| 0.9% | |||
| |||
| |||
|
If the consumer price index changes from 125 in September to 150 in October, what is the rate of inflation?
| |||
| |||
| |||
| 9.1% |
. Suppose a basket of goods and services has been selected to calculate the CPI and 2014 has been selected as the base year. In 2013, the basketâs cost was $80; in 2014, the basketâs cost was $86; and in 2015, the basketâs cost was $90. The value of the CPI in 2015 was
| 104.6 and the inflation rate was 4.6%. | |||
| |||
| |||
|
Suppose a basket of goods and services has been selected to calculate the CPI. In 2002, the basketâs cost was $80; in 2008, the basketâs cost was $92; and in 2010, the basketâs cost was $108. The base year must be
| |||
| 2002 | |||
| 2008 | |||
|
Suppose a basket of goods and services has been selected to calculate the CPI and 2012 has been chosen as the base year. In 2012, the basketâs cost was $80.00; in 2013, the basketâs cost was $84; and in 2014, the basketâs cost was $87.60. The value of the CPI was
| ||||
| ||||
| ||||
|
Which of the following is correct?
| |||
| |||
| |||
|
The inflation rate is defined as the
| |||
| |||
| |||
|
Economists use the term inflation to describe a situation in which
| |||
| |||
| |||
|
1. Consider an economy that produces oranges and boomerangs. The prices and quantities of these goods in two different years are reported in the table below. Fill in the missing entries
| 2016 | 2017 | % change of 2016-2017 | |
| quantity of oranges | 100 | 105 | ? |
| quantity of boomerangs | 20 | 22 | ? |
| price of oranges (dollars) | 1 | 1.10 | ? |
| price of bommerangs (dollars | 3 | 3.10 | ? |
| Nominal GDP | ? | ? | ? |
| Real GDP in 2016 prices | ? | ? | ? |
| Real GDP in 2017 prices | ? | ? | ? |
| Real GDP in chained prices | ? | ? | ? |
2. Consider the economy from the above problem 1.^ Calculate the inflation rate for the 2016â2017 period using the GDP
deflator based on the Laspeyres, Paasche, and chain-weighted indexes of GDP.
3. Indian GDP in 2010 was 78.9 trillion rupees, while U.S. GDP was $14.5 trillion. The exchange rate in 2010 was 45.7 rupees per dollar. India turns out to have lower prices than the United States (this is true more generally for poor countries): the price level in India (converted to dollars) divided by the price level in the United States was 0.368 in 2010.
(a) What is the ratio of Indian GDP to U.S. GDP if we donât take into account the differences in relative prices and simply use the exchange rate to make the conversion?
(b) What is the ratio of real GDP in India to real GDP in the United States in common prices?
(c) Why are these two numbers different?
