ECON 1011 Lecture Notes - Lecture 4: Demand Curve, Gotland Regiment


ECON 1011 verified notes
4/30View all
Document Summary
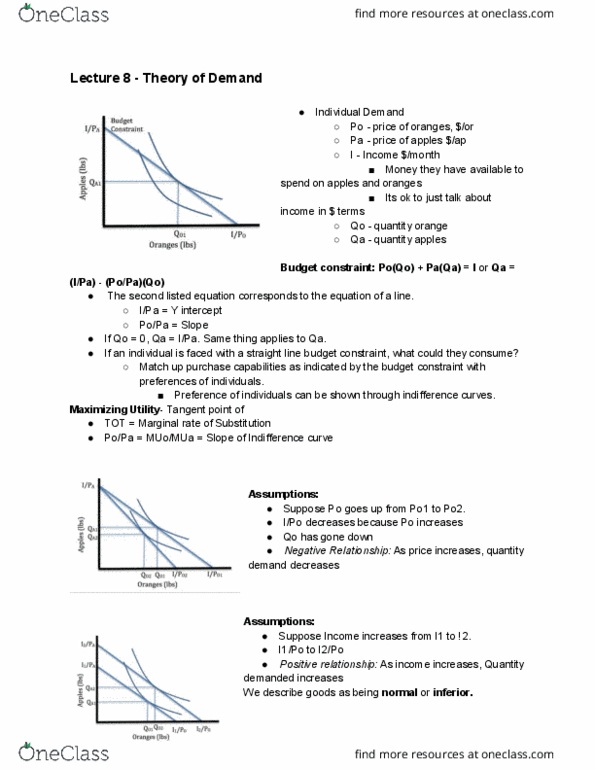
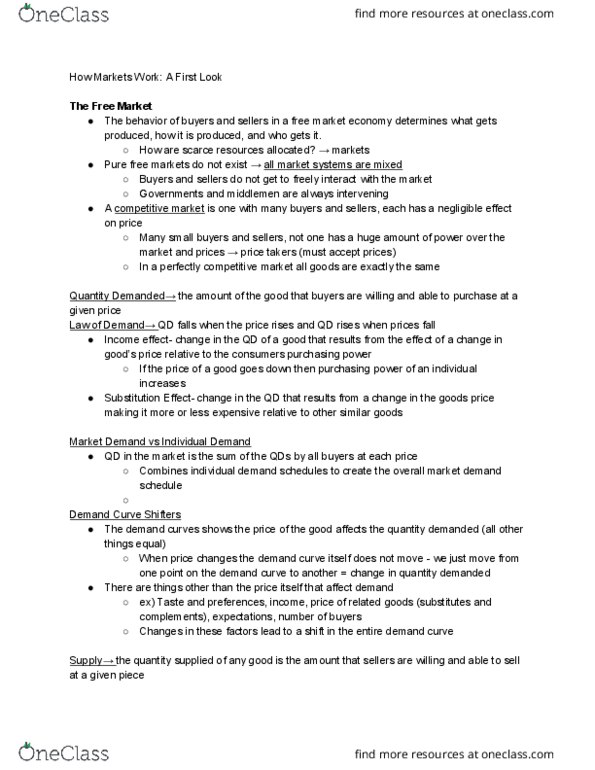
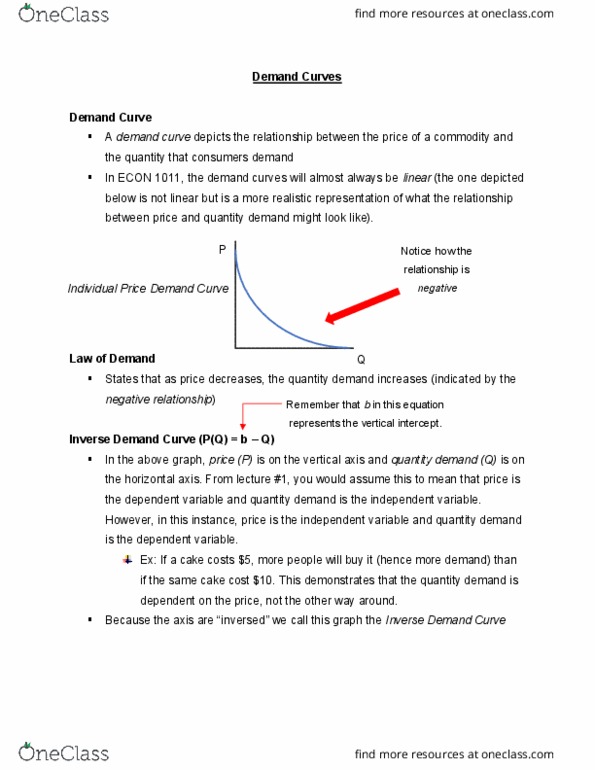
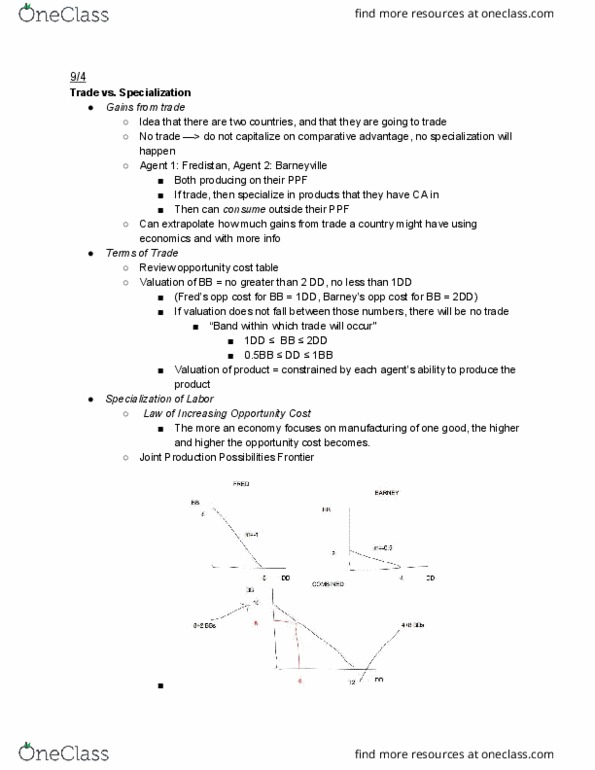
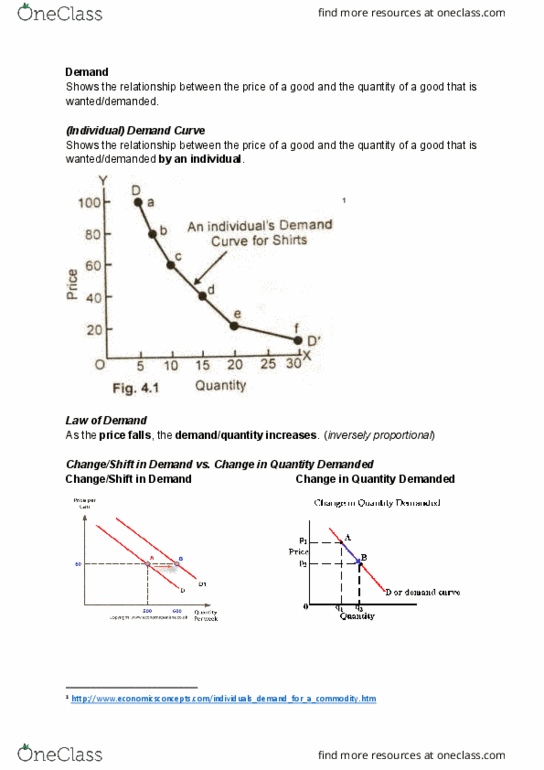
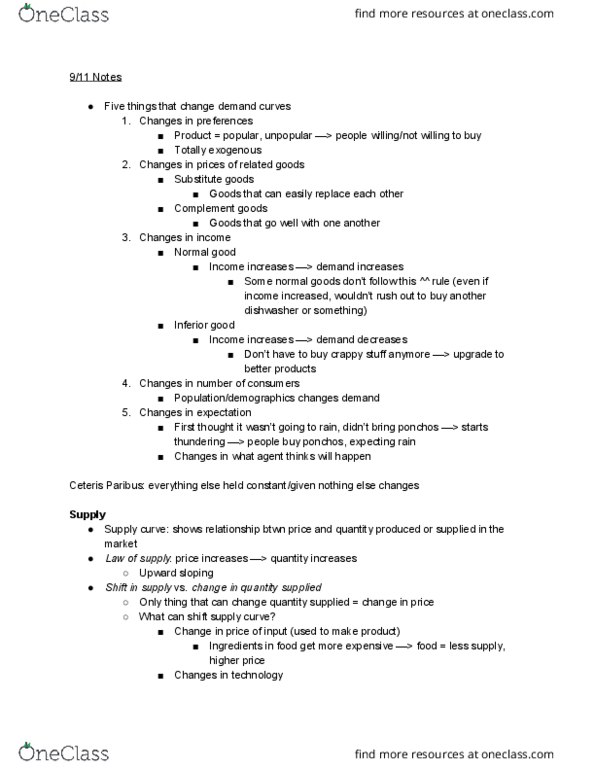
Shows the relationship between the price of a good and the quantity of a good that is wanted/demanded. (individual) demand curve. Shows the relationship between the price of a good and the quantity of a good that is wanted/demanded by an individual. As the price falls, the demand/quantity increases. (inversely proportional) Change/shift in demand vs. change in quantity demanded. Only a change in price can produce a change in quantity demanded. P(q) = 12 q (inverse demand curve) Sum up what each person wants to get market demand curve. Finding the equation of a market demand curve given the individual curves: 5 things that change demand********: changes in preferences, changes in prices of related goods, changes in income, changes in number of consumers, changes in expectations (most subtle and confusing) There are 3 identical agents with a demand curve p = 18 2q.