ECON 1011 Lecture Notes - Lecture 16: Demand Curve, Lead, Fixed Cost
ECON 1011 verified notes
16/30View all
Document Summary
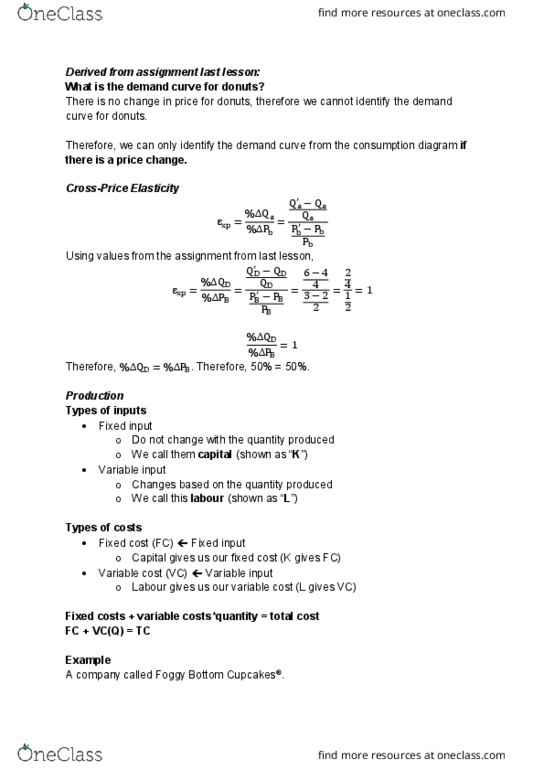
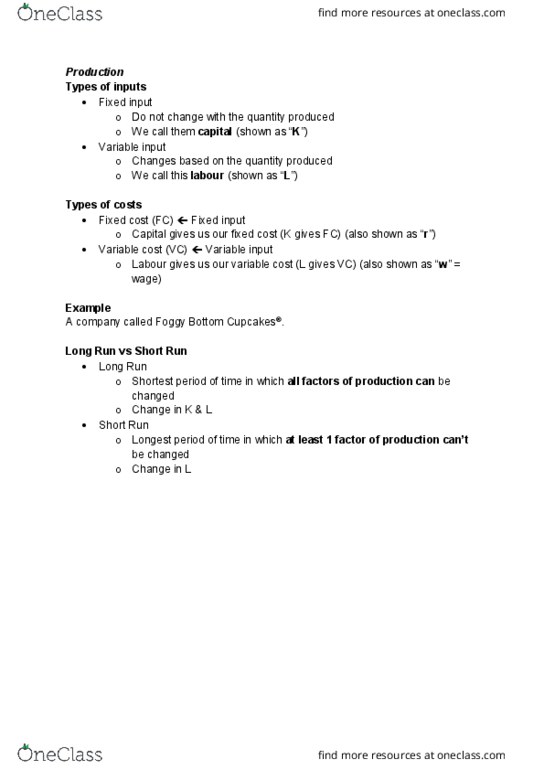
There is no change in price for donuts, therefore we cannot identify the demand curve for donuts. Therefore, we can only identify the demand curve from the consumption diagram if there is a price change. Using values from the assignment from last lesson, Types of inputs: fixed input, do not change with the quantity produced, we call them capital (shown as k , variable input, changes based on the quantity produced, we call this labour (shown as l ) Types of costs: fixed cost (fc) fixed input, capital gives us our fixed cost (k gives fc, variable cost (vc) variable input, labour gives us our variable cost (l gives vc) Fixed costs + variable costs*quantity = total cost. Some fixed inputs include: store front, giant mixer, big oven. Some variable inputs include: batter, electricity, labour. The graph y = 12, where the y-axis represents costs (c) and the x-axis represents quantity (q).


