STAT 3010 Lecture Notes - Lecture 8: Data Set, Box Plot, Interquartile Range

Document Summary
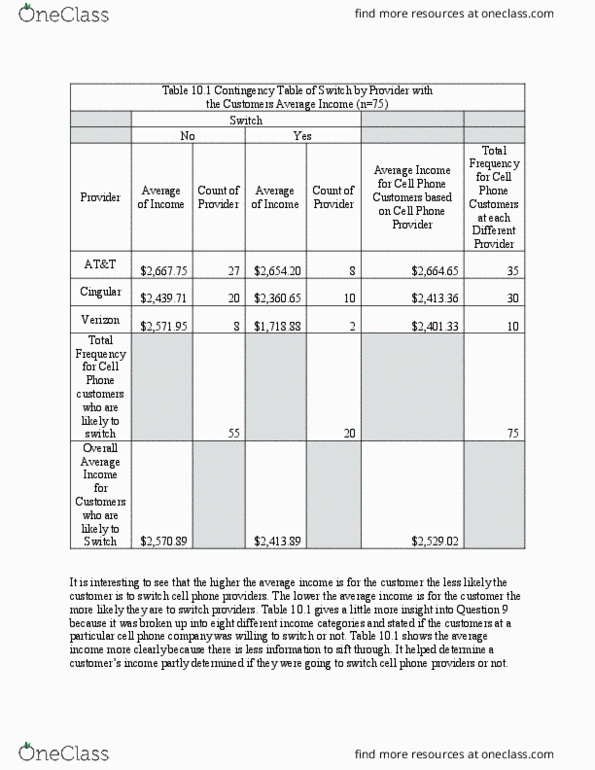
Whether or not the cell phone customer will switch providers. Cell phone providers for the cell phone customers. Income category based on the income of the cell phone customers. Monthly revenue- amount the company receives from the cell phone customers. Bill as percent of monthly income of the cell phone customers. Descriptive statistics for the numerical variables in the cust_srvy. Table 3. 1 descriptive statistics for the data set. Interpretations for the variable prcntmnthinc (assuming that this is a sample of 75 cell phone customers) The average percentage of the 75 cell phone customers" monthly revenue divided by the customer"s average income for this sample is 2. 01%. There is no most frequent data for the percentage of customer"s monthly income because no two customers have the same income. Standard deviation: any percentage of a customer"s monthly income will be off by an average. Count: of 0. 14% from the reported mean of 2. 01%.