STAT 1400 Lecture Notes - Lecture 4: Normal Distribution, Blood Pressure, Confidence Interval

Document Summary
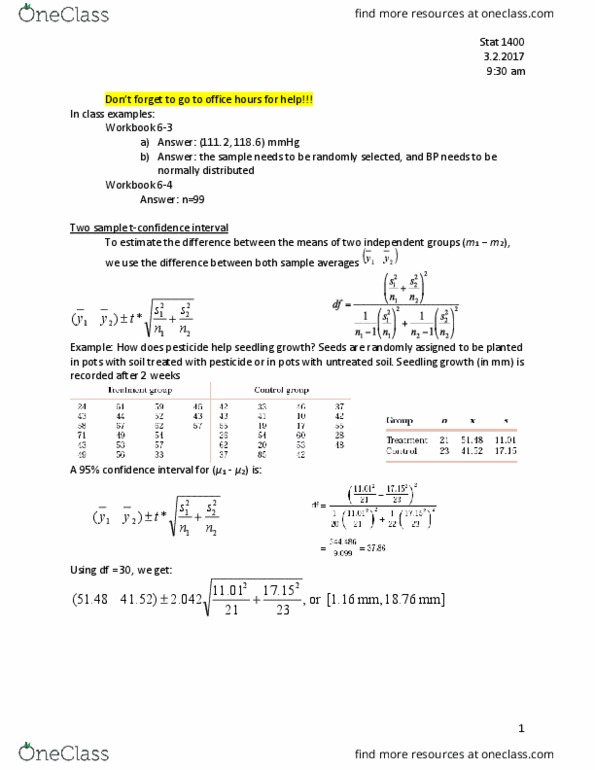
Confidence intervals: a confidence interval is a range of values that contains the true population parameter with a chosen confidence level, we have a set of data from a population with both m and s unknown. We use y to estimate m, and s to estimate s, using a t distribution (df=n 1): centered around the mean. (cid:1872) (cid:1871)/ : for a sample of size n, the sample standard deviation s is, n 1 is the (cid:862)degrees of freedo(cid:373). (cid:863) The results, presented as mean sem for 25 patients, are 113. 5. Ta(cid:374)dard nor(cid:373)al t distri(cid:271)utio(cid:374), df (cid:1008) t distri(cid:271)utio(cid:374), df (cid:1005) Ta(cid:374)dard nor(cid:373)al t distri(cid:271)utio(cid:374), df (cid:1005)(cid:1004)(cid:1004) t distri(cid:271)utio(cid:374), df (cid:1006)(cid:1004) Sample size and experimental design: a study may have a limit set on its margin of error (e. g. , drug trial, manufacturing specs). (cid:1872) (cid:1871)/ : 1. 02 1. 833 (1. 196) / (cid:883)(cid:882) => [0. 33, 1. 71: with 90% confidence, the true population mean sweetness loss is somewhere between 0. 33 and 1. 71.