ACMS10145 Lecture 6: Chapter 6

19 Feb 2019
School
Department
Course
Professor
Document Summary
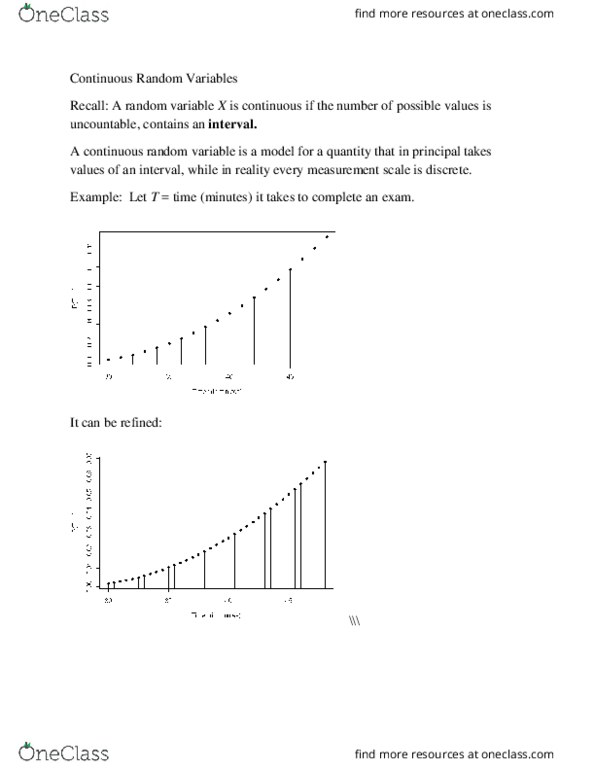
Continuous random variables are described by probability density functions, or pdfs, which are denoted by !(#). The pdf describes a curve, and areas underneath the curve represent probabilities. Since the areas represent probabilities, the total area beneath any pdf is always equal to 1. We will take a look at three different types of continuous distributions, the uniform, normal and exponential. By far, the normal is the most useful in all areas of statistics. Consider the random variable x representing the flight time of an airplane traveling from. Suppose the flight time can be any value in the interval from 120 minutes to 140 minutes. Because x can be any value in that interval, x is a continuous rather than a discrete random variable. With every 1-minute interval being equally likely, the random variable x is said to have a uniform probability distribution. In general, the pdf for uniform probability distribution (a,b) is.