ACMS10145 Lecture Notes - Lecture 4: Central Limit Theorem, Frequency Distribution, Exploratory Data Analysis

26 Feb 2016
School
Department
Course
Professor
Document Summary
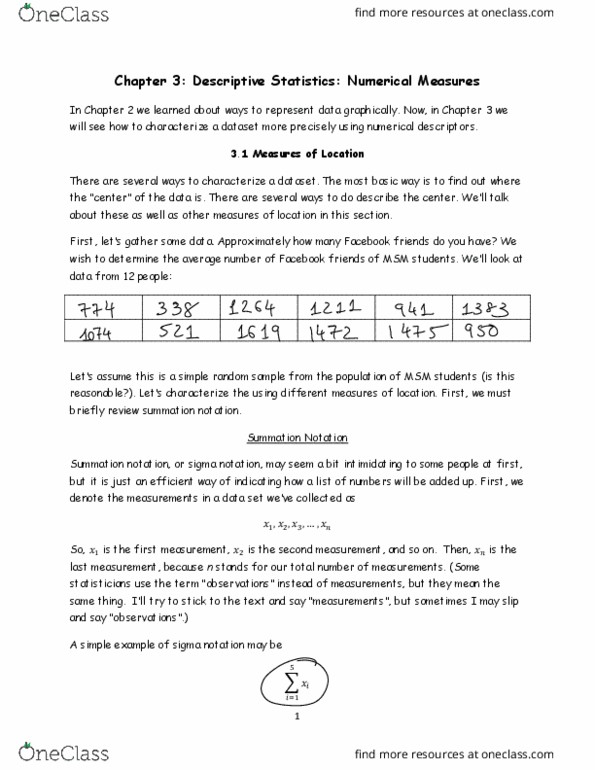
In chapter 2 we learned about ways to represent data graphically. Now, in chapter 3 we will see how to characterize a dataset more precisely using numerical descriptors. There are several ways to characterize a dataset. The most basic way is to find out where the center of the data is. There are several ways to do describe the center. We"ll talk about these as well as other measures of location in this section. We wish to determine the average number of facebook friends of acms 10145 students. Let"s assume this is a simple random sample from the population of acms 10145 students (is this reasonable?). Let"s characterize the using different measures of location. Summation notation, or sigma notation, may seem a bit intimidating to some people at first, but it is just an efficient way of indicating how a list of numbers will be added up. First, we denote the measurements in a data set we"ve collected as.