ECON 1116 Lecture Notes - Lecture 3: Ceteris Paribus, Demand Curve, Inferior Good

10 Feb 2017
School
Department
Course
Professor
Document Summary
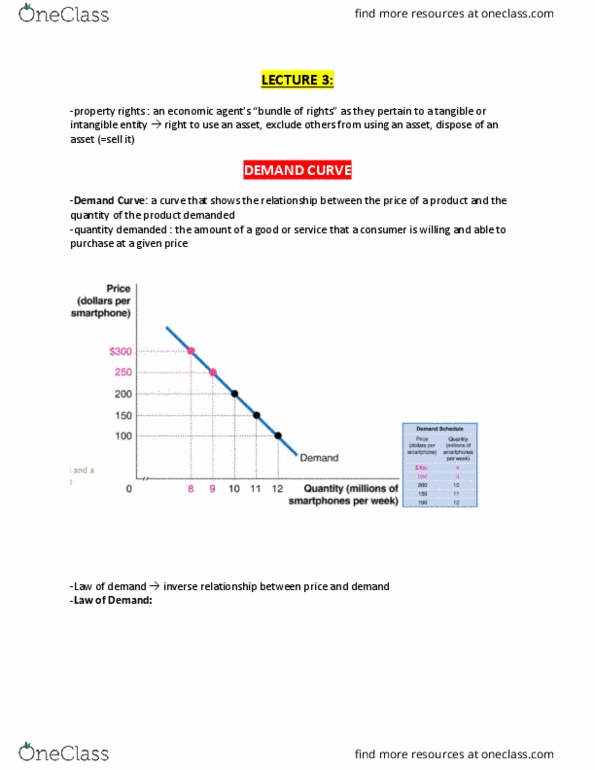
Demand schedule- a table that shows the relationship between the price of a product and the quantity of a product. Quantity demand- the amount of a good or service that a consumer is willing and able to purchase at a given price. Demand curve- a curve that shows the relationship between a product and the quantity of the product demanded. Market demand curve- a curve that illustrates the relationship between the quantity of a good or service that all consumers are willing and able to purchase and its price (over some given period of time) It has a negative slope, reflecting the law of demand, the rule that holding everything constant, when the price of a product falls the quantity demanded will increase and vice versa. The consumer now has greater purchasing power and is likely to purchase more goods. The market de(cid:373)a(cid:374)d (cid:272)u(cid:396)ve holds othe(cid:396) possi(cid:271)le i(cid:374)flue(cid:374)(cid:272)es (cid:272)alled (cid:862)dete(cid:396)(cid:373)i(cid:374)a(cid:374)ts of de(cid:373)a(cid:374)d(cid:863) (cid:272)o(cid:374)sta(cid:374)t.