PSY 2110 Lecture Notes - Lecture 3: Percentile, Histogram, Ator

23 Sep 2016
School
Department
Course
Professor
Document Summary
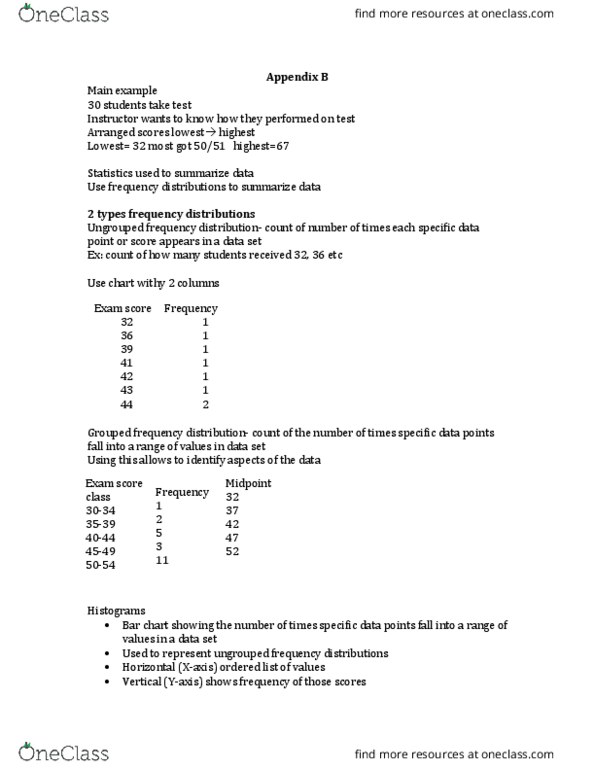
Raw data data as originally collected f = n. Simple frequency distribution: go through raw data, find lowest and highest scores, list each possible score between lowest and highest, including them, tally corresponding frequency. Class intervals groups numerically defined in such a way that any given raw score can belong to one and only one group. Cumulative frequency the frequency of all scores at or below a particular score. Relative percentage percentage of time the raw score occurs in the sample or population (f/n) * 100 = % Real limits refers to those points falling one-half a measurement unit above or below a particular number. Cumulative percentage percentile the percentage of cases at or below a particular score. The score at the nth percentile will be the upper real limit of the class interval. Average of the upper and lower real limits. Adjacent bars touch as long as there is a frequency.