PSY 202 Lecture Notes - Lecture 5: Statistical Inference, Central Tendency, Frequency Distribution

15 Oct 2018
School
Department
Course
Professor
Document Summary
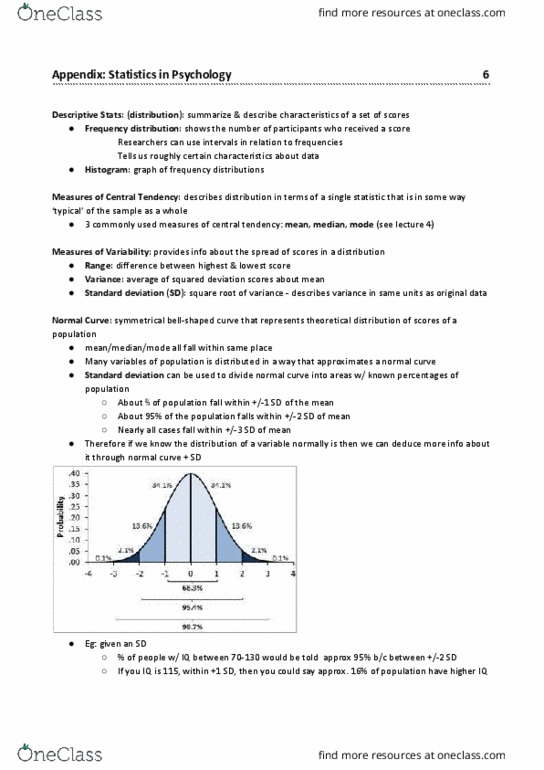
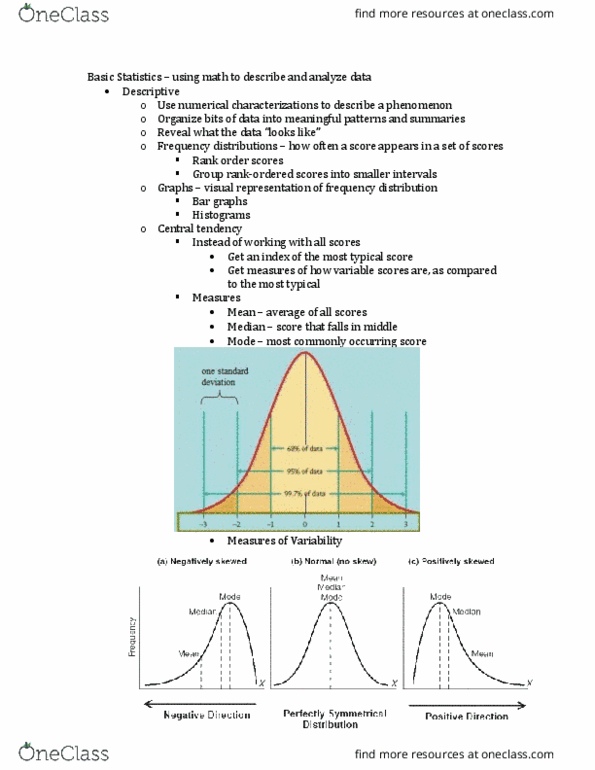
Exam 1 next thursday will cover ch1 & appendix a (syllabus for more details) Extended office hours wednesday 12-3 if any questions about exam. See 5 key provisions by apa in the textbook. Stats- branch of math used to work with data. Descriptive stats: stats used to describe data duh. Other types of graphs for graphs for distribution in appendix. A number indicating info about the center" of the distribution - mode, mean, median. Standard deviation how far scores are from the mean in quantity on the x axis. Two reasons for sd - variance (spread) and outliers (any data point 2-3 sd away) In a positively skewed data will go to the right. In negative it will drag to the left. Inferential stats - stats used to determine how likely results are to be due to chance. Type i error - false positive *just think of pregnancy tests and you gucci. I know your bored hannah but keep going.