STAT 1000 Lecture Notes - Lecture 2: Pie Chart, Bar Chart, Frequency Distribution

Document Summary
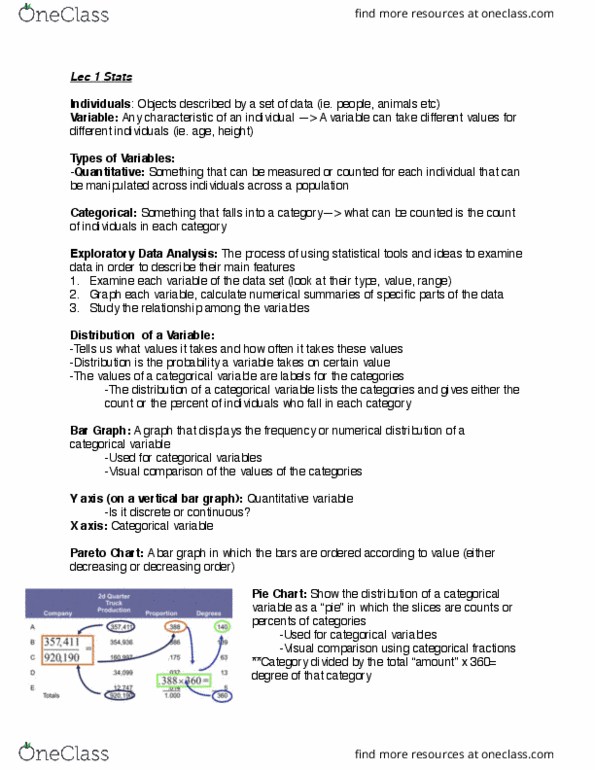
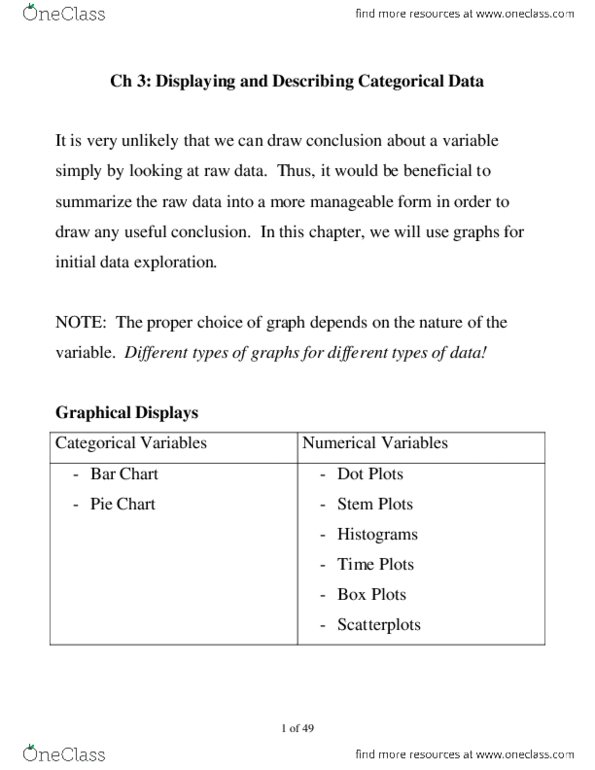
Stage 2 of states is: display and summarizing: Discriptive statistics: shape of the distribution, central tendency, variability. Stem plots (this and histogram are quantitative. Pie chart (this and bar graph are categorical) Categorical: distribution of categorical variable lists categories and gives the count or percent of cases that fal into each category. Nominal or ordinal data can be displayed this way. Ex: in a pie chart the section represent % of 100% of the circle. And they must add up to 100%, otherwise can"t make a pie chart. Bar grapj: each category is represented by a bar, the bars don"t overlap. You either fall into one category or you dont, and height of bar is percent or proportion or count of how many are or arent in that category. Pie charts can only be used to describe the distribution of a single variable. Ex: first problem is they dont add up to 100%.