BIOL 12100 Lecture Notes - Lecture 15: Overexploitation, Rotifer, Life Table

24 Feb 2015
School
Department
Course
Professor
Document Summary
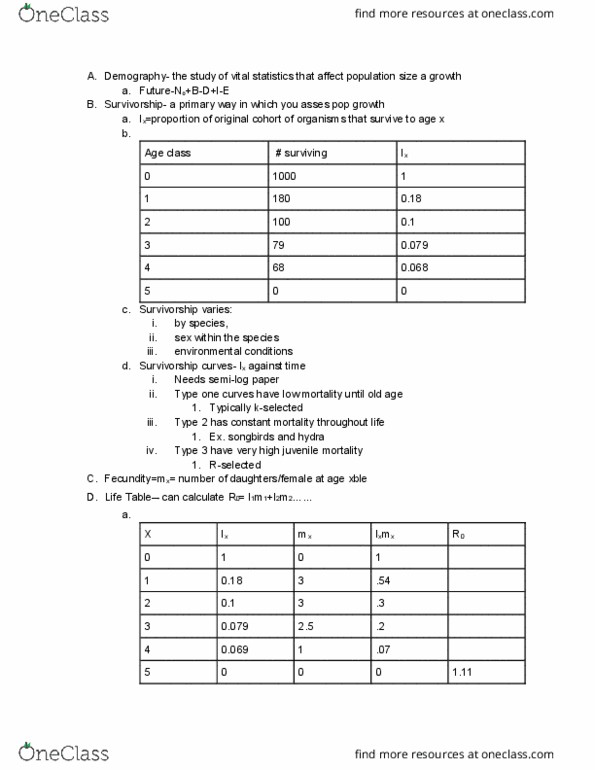
Vital statistics that affect population size and growth. N(future) = no + birth - death + immigration - emigration. Lx = proportion of cohort(group of individuals born in the same time) surviving to age x. Vertical scale 0. 10 => . 1 => 1 => 10. Mx = # daughter / female at age x. 0 sum it all lxmx & ro = 1. 11. Graphical reproduction of proportion of individuals in each age class. Growing age distribution - looks like triangle. Stable age distribution - looks like tall pentagon. Declining distribution - looks like a slim hexagon. Relative abundance of reproductive individuals to non-individuals reproductive individuals. Life history - all character that impact reproduction and survival. Ex) rotifers - negative correlation current fecundity probability of future survival. 10 nests have 3 eggs, 10 nests have 2 eggs (1 removed), 10 nests have. Nest with artificially increased eggs lead to fewer fledglings. Reproduce early and often fugitive species => high r values.