01:220:102 Lecture Notes - Lecture 2: Opportunity Cost, Demand Curve

01:220:102 verified notes
2/27View all

Document Summary
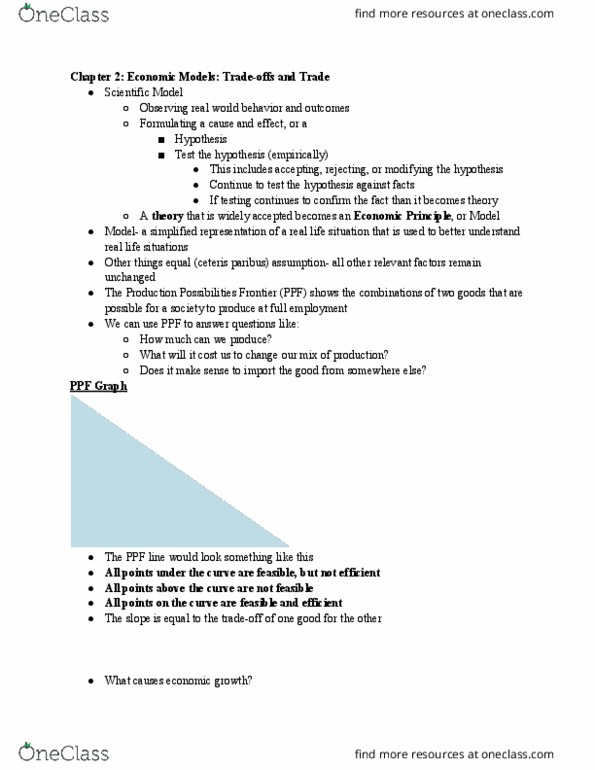
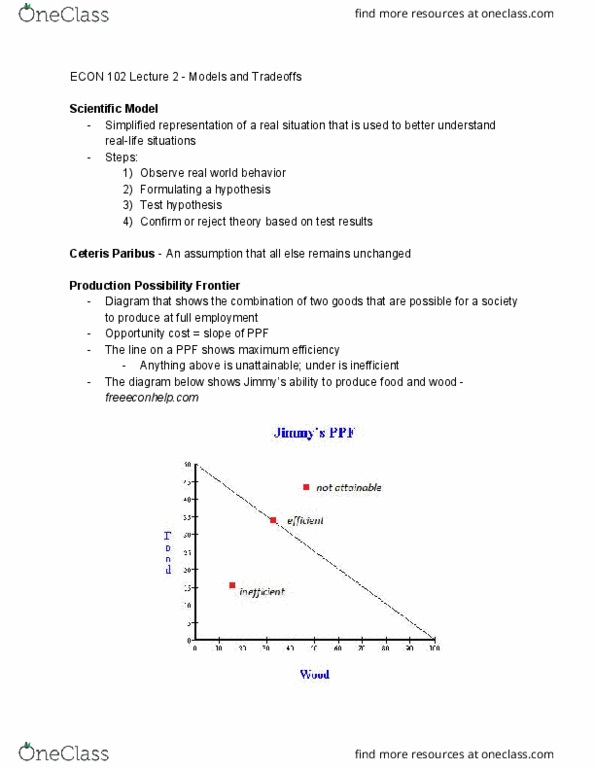
Econ 102 lecture 2 - models and tradeoffs. Simplified representation of a real situation that is used to better understand real-life situations. Steps: observe real world behavior, formulating a hypothesis, test hypothesis, confirm or reject theory based on test results. An assumption that all else remains unchanged. Diagram that shows the combination of two goods that are possible for a society to produce at full employment. The line on a ppf shows maximum efficiency. Anything above is unattainable; under is inefficient. The diagram below shows jimmy"s ability to produce food and wood - freeeconhelp. com. Increase in market price leads to an increase in quantity supplied. Movement along demand curve is not the same as shift. Sellers will supply less of a good if it is less profitable. Technological innovation lowers costs and increases supply. Expectation of a higher price in the future decreases supply due to expectation of larger profitability in the future.