01:960:285 Lecture Notes - Lecture 3: Bias Of An Estimator, Statistical Inference, Quartile
01:960:285 verified notes
3/28View all
Document Summary
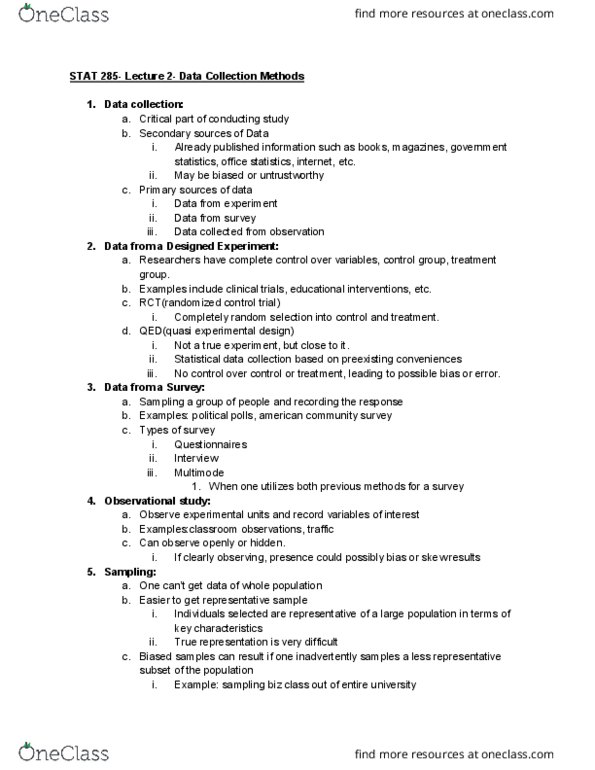
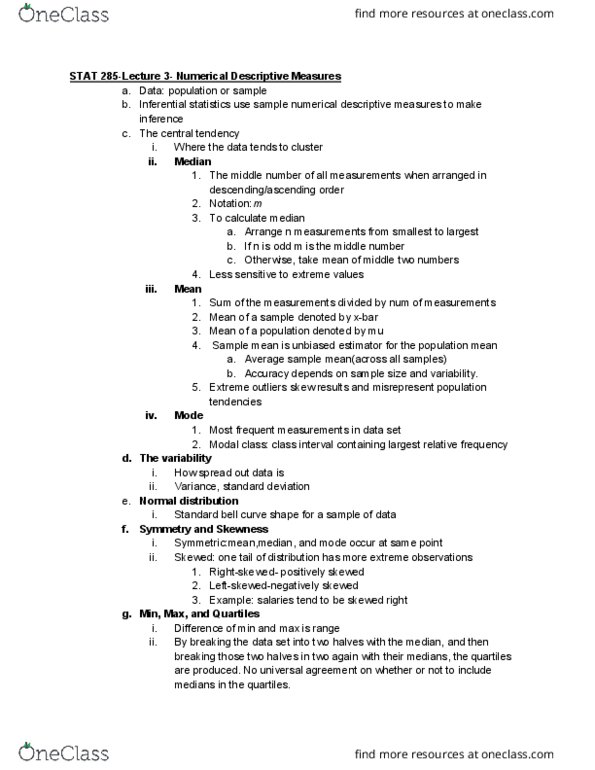
Standard bell curve shape for a sample of data: symmetry and skewness. Skewed: one tail of distribution has more extreme observations: right-skewed- positively skewed, left-skewed-negatively skewed, example: salaries tend to be skewed right, min, max, and quartiles, difference of min and max is range. By breaking the data set into two halves with the median, and then breaking those two halves in two again with their medians, the quartiles are produced. No universal agreement on whether or not to include medians in the quartiles. The difference between the quartile with the lowest numbers(q1) and the quartile with the highest numbers(q4) is called the interquartile range, or. Expected to calculate quartiles using excel for large data sets: excel quartile function gives number between each quartile. Percentiles come about when you break the set into 100 pieces: excel percentile function requires decimal inputs, often used percentiles: 1st and 99th, 5th and 95th, 2. 5th and.


