01:960:401 Lecture Notes - Lecture 16: Statistical Hypothesis Testing, Standard Deviation, Random Variable

15 May 2018
School
Department
Course
Professor

Chapter 10
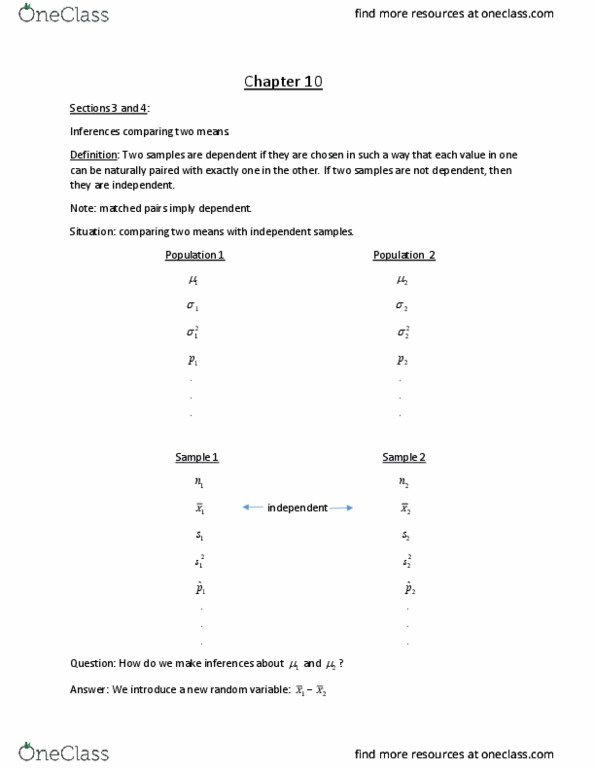
Section 9: Comparing proportions from 2 populations.
Question: How do we make inferences about
1
p
and
2
p
?
Answer: We introduce a new random variable
12
ˆˆ
pp−
, where
1
1
1
ˆx
pn
=
, and
2
2
2
ˆx
pn
=
where
1
x
is the number of successes in sample 1 and
1
n
is the number of trials in a binomial experiment
from population 1, and
2
x
is the number of successes in sample 2 and
2
n
is the number of trials
in a binomial experiment from population 2. It turns out that the distribution of
12
ˆˆ
pp−
has a
mean of
12
pp−
and a standard deviation of
1 1 2 2
12
p q p q
nn
+
.
Large sample hypothesis test of
12
pp−
, based on
12
ˆˆ
pp−
.
The null and alternative hypothesis can take on one of the following form:
0 1 2
:H p p=
or
12
0pp−=
1 1 2
:H p p
or
12
0pp−
(left-tailed test)
0 1 2
:H p p=
or
12
0pp−=
1 1 2
:H p p
or
12
0pp−
(right-tailed test)
0 1 2
:H p p=
or
12
0pp−=
1 1 2
:H p p
or
12
0pp−
(two-tailed test)
We assume the samples are independent and
11
ˆ
np
,
11
ˆ
nq
,
22
ˆ
np
,
22
ˆ
nq
are all greater than or
equal to 10.
Recall when doing hypothesis testing we assume
0
H
is true. When we did a hypothesis test for
one proportion we used the hypothesized
p
when calculating
ˆ
p
pq
n
=
.
find more resources at oneclass.com
find more resources at oneclass.com
Document Summary
Answer: we introduce a new random variable p. 2 where 1x is the number of successes in sample 1 and. 1n is the number of trials in a binomial experiment from population 1, and. 2x is the number of successes in sample 2 and. 2n is the number of trials in a binomial experiment from population 2. It turns out that the distribution of p. 1 and a standard deviation of p q. The null and alternative hypothesis can take on one of the following form: We assume the samples are independent and 1 1 n p , 1 1 n q , equal to 10. 2 2 n q are all greater than or. When we did a hypothesis test for one proportion we used the hypothesized p when calculating. Hence we must calculate a pooled estimate for p from information from both samples. The pooled estimate for p, denoted p , is p x.


 is 0.64.
 : p = 0.65 against
  : p > 0.65. Use α= 0.05.


