ECON 101 Lecture Notes - Lecture 4: Fiscal Policy, Aggregate Demand, Liquidity Trap
36 views12 pages

25 Sep 2016
School
Department
Course
Professor
Document Summary
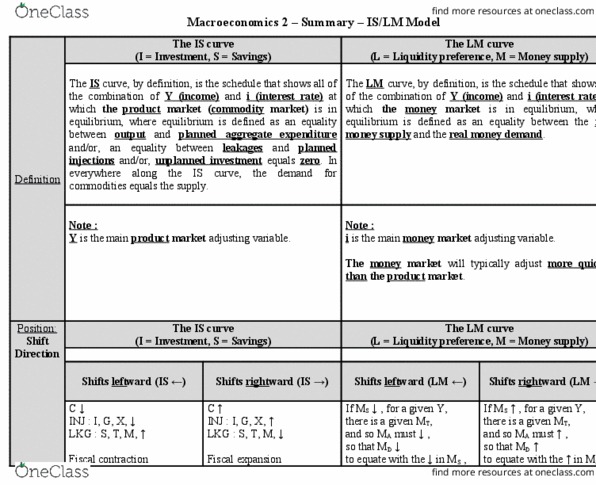
In other words, the ad curve shows all of the combination of p (price) and y (income) consistent with simultaneous equilibrium in the product and money markets. Is and lm together summarize the entire expenditure side of the economy. According to the keynesian cross diagram (450 degree line diagram) : Ae = c + i + g + x m = +ve f (y) , for given i and given p. According to the is lm framework : Ae = c + i + g + x m = +ve f (y) , for given p. Ae = c + i + g + x m = ve f (i) , for given p. Shifts in the same direction as the is shift. Shifts in the same direction as the lm shift. Lkg : s, t, m, (is ) Lkg : s, t, m, (lm )
Get access
Grade+20% off
$8 USD/m$10 USD/m
Billed $96 USD annually

Homework Help
Study Guides
Textbook Solutions
Class Notes
Textbook Notes
Booster Class
40 Verified Answers
Class+
$8 USD/m
Billed $96 USD annually

Homework Help
Study Guides
Textbook Solutions
Class Notes
Textbook Notes
Booster Class
30 Verified Answers
Related Documents
Related Questions
| a) | In the AD-AS model, stagflation does not persist, because the working of the self-correcting mechanism of the economy _____ the level of output and _____ the price level until the economy eventually returns to a long-run equilibrium state, where actual output _____ potential output.
|
| b) | The LRAS curve is drawn as a vertical line at potential output (Y*) to indicate that
|
| c) | Stagflation arises in the context of the AD-AS model when some external factor causes
|
| d) | If the SRAS curve is positively sloped, then a decrease in the demand for Canadian-made goods in Europe will lead to _____ in the price level, in the short run.
|
| e) | Which of the following will shift the aggregate demand curve to the right?
|
| f) | Suppose a stock market crash decreases the stock of household wealth and therefore causes autonomous consumption to fall. Which of the following is the likely result?
|
| g) | An economy is characterized by the AD equation P = 200 ? 0.02Y, SRAS equation P = 100 and LRAS equation Y* = 5000. In the absence of any change in policy or exogenous shocks, this economy will achieve a long-run price level of
|
| h) | The AD-AS model depicts a self-correcting economy. This means that the price level in the model adjusts automatically in response to a(n) _____ gap, so as to eliminate the _____ gap in the long run, without requiring any help from government policies.
|
| i) | The aggregate demand curve shows
|
| j) | Consider an economy initially at long-run equilibrium with output (Y) equal to potential output (Y*). If the SRAS is positively sloped, then a shift to the right of the AD curve will lead to _____ in the price level, in the short run. In the long run, the SRAS curve will shift to the _____ and the equilibrium will be at __________.
|
