ASOC 220 Lecture Notes - Lecture 28: Iqvia, Confidence Interval, Central Tendency

2 Jun 2017
School
Department
Course
Professor
Document Summary
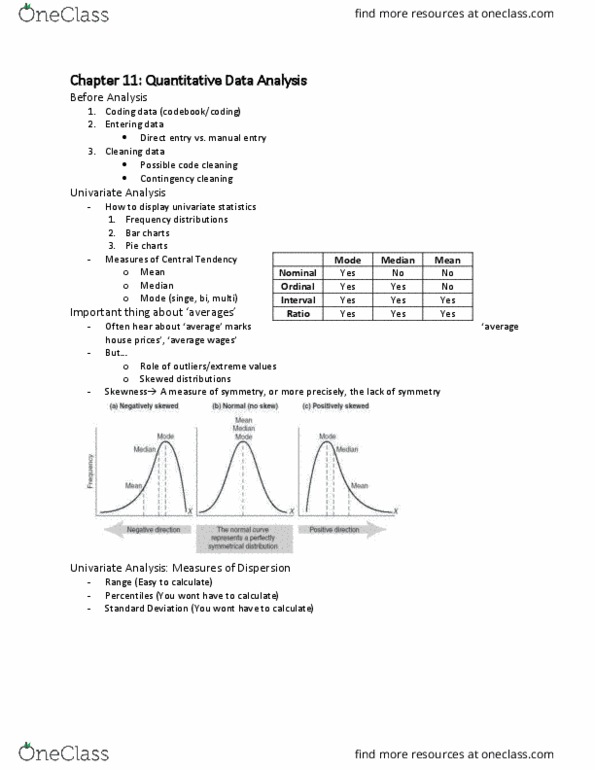
Introduction to social research quantitative data analysis wednesday, april 5, 2017. * mean the average average speed, average weight, average income the sum of all values divided by the number of observations. * median the middle where 50% of observations are above and. 50% below useful for distributions with extreme values: income, house value millennial median = 23. 51. * mode the most frequently observed value. * normal distribution, mean, median and mode would be equal. * standard deviation the average distance of each score from the mean. * difference between the score and the mean is squared . * the scores furthest from the mean have the greatest effect. * the square root of the sum of squares . * a method for comparing dispersion among different groups a narrow variation in test scores for one class means that everyone performed the same a wide variation means there was little similarity.