ACC 151 Lecture 22: Statement of Cash Flow

Document Summary
Get access


Related Documents
Related Questions

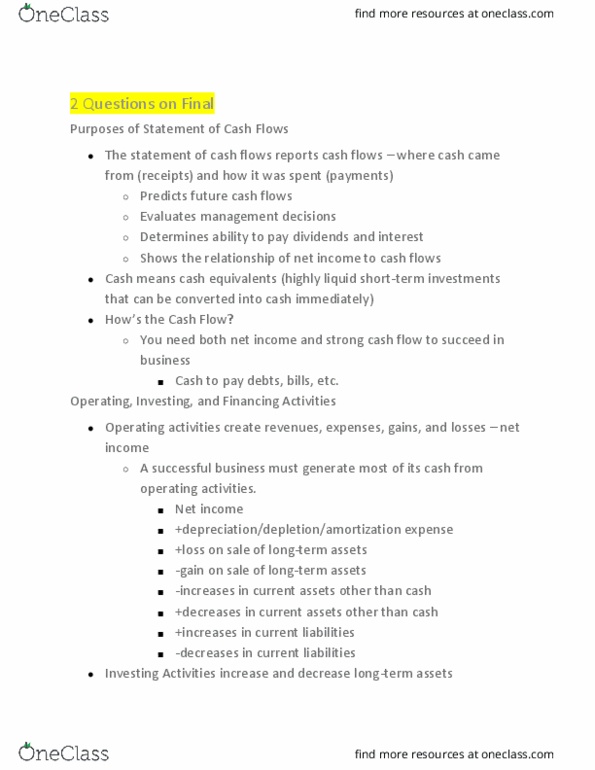
EXHIBIT 5
AMAZON.COM, INC.
CONSOLIDATED STATEMENTS OF CASH FLOWS
(in millions)
| Year Ended December 31, | ||||||||||
2014 | 2013 | 2012 | |||||||||
CASH AND CASH EQUIVALENTS, BEGINNING OF PERIOD | $ | 8,658 | $ | 8,084 | $ | 5,269 | |||||
OPERATING ACTIVITIES: | |||||||||||
Net income (loss) | (241 | ) | 274 | (39 | ) | ||||||
Adjustments to reconcile net income (loss) to net cash fromoperating activities: | |||||||||||
Depreciation of property and equipment, including internal-usesoftware and website development, and other amortization | 4,746 | 3,253 | 2,159 | ||||||||
Stock-based compensation | 1,497 | 1,134 | 833 | ||||||||
Other operating expense (income), net | 129 | 114 | 154 | ||||||||
Losses (gains) on sales of marketable securities, net | (3 | ) | 1 | (9 | ) | ||||||
Other expense (income), net | 62 | 166 | 253 | ||||||||
Deferred income taxes | (316 | ) | (156 | ) | (265 | ) | |||||
Excess tax benefits from stock-based compensation | (6 | ) | (78 | ) | (429 | ) | |||||
Changes in operating assets and liabilities: | |||||||||||
Inventories | (1,193 | ) | (1,410 | ) | (999 | ) | |||||
Accounts receivable, net and other | (1,039 | ) | (846 | ) | (861 | ) | |||||
Accounts payable | 1,759 | 1,888 | 2,070 | ||||||||
Accrued expenses and other | 706 | 736 | 1,038 | ||||||||
Additions to unearned revenue | 4,433 | 2,691 | 1,796 | ||||||||
Amortization of previously unearned revenue | (3,692 | ) | (2,292 | ) | (1,521 | ) | |||||
Net cash provided by (used in) operating activities | 6,842 | 5,475 | 4,180 | ||||||||
INVESTING ACTIVITIES: | |||||||||||
Purchases of property and equipment, including internal-usesoftware and website development | (4,893 | ) | (3,444 | ) | (3,785 | ) | |||||
Acquisitions, net of cash acquired, and other | (979 | ) | (312 | ) | (745 | ) | |||||
Sales and maturities of marketable securities and otherinvestments | 3,349 | 2,306 | 4,237 | ||||||||
Purchases of marketable securities and other investments | (2,542 | ) | (2,826 | ) | (3,302 | ) | |||||
Net cash provided by (used in) investing activities | (5,065 | ) | (4,276 | ) | (3,595 | ) | |||||
FINANCING ACTIVITIES: | |||||||||||
Excess tax benefits from stock-based compensation | 6 | 78 | 429 | ||||||||
Common stock repurchased | â | â | (960 | ) | |||||||
Proceeds from long-term debt and other | 6,359 | 394 | 3,378 | ||||||||
Repayments of long-term debt | (513 | ) | (231 | ) | (82 | ) | |||||
Principal repayments of capital lease obligations | (1,285 | ) | (775 | ) | (486 | ) | |||||
Principal repayments of finance lease obligations | (135 | ) | (5 | ) | (20 | ) | |||||
Net cash provided by (used in) financing activities | 4,432 | (539 | ) | 2,259 | |||||||
Foreign-currency effect on cash and cash equivalents | (310 | ) | (86 | ) | (29 | ) | |||||
Net increase (decrease) in cash and cash equivalents | 5,899 | 574 | 2,815 | ||||||||
CASH AND CASH EQUIVALENTS, END OF PERIOD | $ | 14,557 | $ | 8,658 | $ | 8,084 | |||||
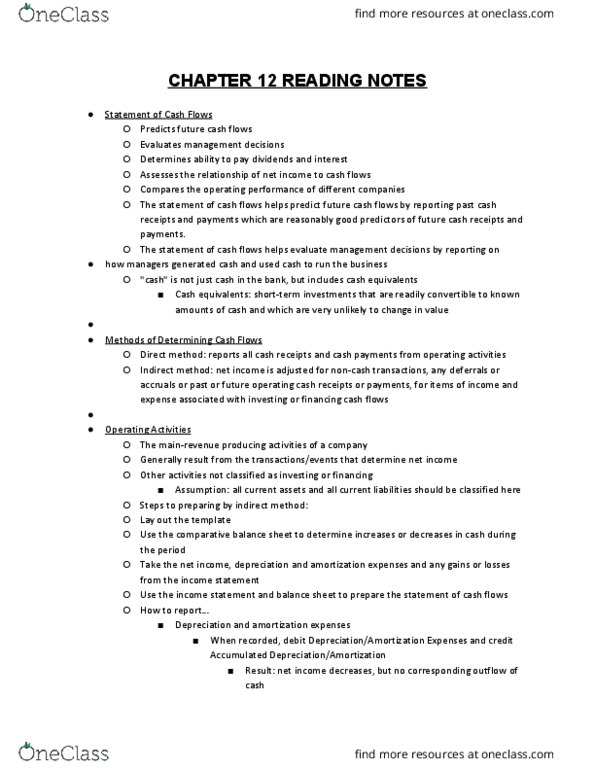
EXHIBIT 6
AMAZON.COM, INC.
CONSOLIDATED STATEMENTS OF OPERATIONS
(in millions, except per share data)
| Year Ended December 31, | ||||||||||
2014 | 2013 | 2012 | |||||||||
Net product sales | $ | 70,080 | $ | 60,903 | $ | 51,733 | |||||
Net service sales | 18,908 | 13,549 | 9,360 | ||||||||
Total net sales | 88,988 | 74,452 | 61,093 | ||||||||
Operating expenses: | |||||||||||
Cost of sales | 62,752 | 54,181 | 45,971 | ||||||||
Fulfillment | 10,766 | 8,585 | 6,419 | ||||||||
Marketing | 4,332 | 3,133 | 2,408 | ||||||||
Technology and content | 9,275 | 6,565 | 4,564 | ||||||||
General and administrative | 1,552 | 1,129 | 896 | ||||||||
Other operating expense (income), net | 133 | 114 | 159 | ||||||||
Total operating expenses | 88,810 | 73,707 | 60,417 | ||||||||
Income from operations | 178 | 745 | 676 | ||||||||
Interest income | 39 | 38 | 40 | ||||||||
Interest expense | (210 | ) | (141 | ) | (92 | ) | |||||
Other income (expense), net | (118 | ) | (136 | ) | (80 | ) | |||||
Total non-operating income (expense) | (289 | ) | (239 | ) | (132 | ) | |||||
Income (loss) before income taxes | (111 | ) | 506 | 544 | |||||||
Provision for income taxes | (167 | ) | (161 | ) | (428 | ) | |||||
Equity-method investment activity, net of tax | 37 | (71 | ) | (155 | ) | ||||||
Net income (loss) | $ | (241 | ) | $ | 274 | $ | (39 | ) | |||
Basic earnings per share | $ | (0.52 | ) | $ | 0.60 | $ | (0.09 | ) | |||
Diluted earnings per share | $ | (0.52 | ) | $ | 0.59 | $ | (0.09 | ) | |||
Weighted average shares used in computation of earnings pershare: | |||||||||||
Basic | 462 | 457 | 453 | ||||||||
Diluted | 462 | 465 | 453 | ||||||||
Cash Flows at Amazon.com
Case Questions:
Graph the financial statement items in Exhibit 1. Graph revenueand COGS separate from the other items in Exhibit 1 because oftheir magnitude (i.e., make two graphs).
Using the graphs above, identify time periods of similarcharacteristics and classify them using the following life cycleterms: introduction, growth, maturity, or decline (see Exhibit 4for definitions). For each period labeled, provide support for yourclassification. Specifically, briefly discuss the patterns observed(e.g., in revenue, income, operating cash flow, investing cashflow, and financing cash flow) and how they indicate whereAmazon.com is in the life cycle.
What is the general trend in cash flows from investingactivities in Exhibit 3 from 1995 to 2010? Discuss both the netcash flows from investing activities (CFI) and the components ofCFI.
Why did Amazon.com invest in marketable securities (Exhibit 3,net change in securities)?
Analyze Amazon.comâs performance for fiscal year ended December31, 2014 using its Consolidated Statements of Cash Flows (Exhibit5) and Consolidated Statement of Operations (Exhibit 6).Specifically, answer the following questions:
(a) What are Amazon.comâs net incomeor loss over the three years? Comment on the companyâsprofitability.
(b) Comment on Amazon.comâsperformance using cash flows from operating, investing andfinancing activities over the three-year period.
(c) How do you reconcile the largediscrepancy between a net loss of $241 million and net cash fromoperating activities of $6,842 million for fiscal year endedDecember 31, 2014?
I need all of these answeredthouroughly!!! Like as best as possible with as much explanation! Icould not fit intoi one post so the others 2 post before this arerelated!!! Thank you!

| Comparative financial statement data for Carmono Company follow: |
| This Year | Last Year | |||
| Assets | ||||
| Cash | $ | 7.50 | $ | 14.00 |
| Accounts receivable | 50.00 | 43.00 | ||
| Inventory | 92.50 | 79.20 | ||
| Total current assets | 150.00 | 136.20 | ||
| Property, plant, and equipment | 231.00 | 194.00 | ||
| Less accumulated depreciation | 45.60 | 34.20 | ||
| Net property, plant, and equipment | 185.40 | 159.80 | ||
| Total assets | $ | 335.40 | $ | 296.00 |
| Liabilities and Stockholdersâ Equity | ||||
| Accounts payable | $ | 55.50 | $ | 46.00 |
| Common stock | 118.00 | 91.00 | ||
| Retained earnings | 161.90 | 159.00 | ||
| Total liabilities and stockholdersâ equity | $ | 335.40 | $ | 296.00 |
| For this year, the company reported net income as follows: |
| Sales | $ | 850.00 |
| Cost of goods sold | 510.00 | |
| Gross margin | 340.00 | |
| Selling and administrative expenses | 320.00 | |
| Net income | $ | 20.00 |
| This year Carmono declared and paid a cash dividend. There were no sales of property, plant, and equipment during this year. The company did not repurchase any of its own stock this year. Carmono CompanyStatement of Cash Flows - Indirect MethodFor This Year Ended December 31Operating activities:Net income$20.00Adjustments to convert net income to a cash basis:Depreciation$11.40Increase in accounts receivable(7.00)Increase in inventory(13.30)Increase in accounts payable9.500.60Net cash provided by operating activities20.60Investing activities:Increase in plant and equipment(37.00)Net cash used in investing activities(37.00)Financing activities:Increase in common stock27.00Cash dividends(17.10)Net cash provided by financing activities9.90Net decrease in cash(6.50)Beginning cash and cash equivalents14.00Ending cash and cash equivalents$7.50 |
| | ||
| 2. | Compute Carmonoâs free cash flow for this year. (Negative amount should be indicated by a minus sign. Round your intermediate calculations and final answer to 2 decimal places.) |
Free cash flow$
3.
| Changes in various accounts and gains and losses on the sale of assets during the year for Argon Company are given below: |
| Item | Amount | ||
| Accounts receivable | $ | 79,000 | decrease |
| Inventory | $ | 120,000 | increase |
| Prepaid expenses | $ | 3,500 | decrease |
| Accounts payable | $ | 41,000 | decrease |
| Accrued liabilities | $ | 9,600 | increase |
| Income taxes payable | $ | 15,700 | increase |
| Sale of equipment | $ | 8,100 | gain |
| Sale of long-term investments | $ | 12,200 | loss |
| Required: |
| For each item, indicate whether the dollar amount should be added to or deducted from net income under the indirect method when computing the net cash provided by operating activities for the year. |
|
4.
| Apex Company prepared the statement of cash flows for the current year that is shown below: |
| Apex Company Statement of Cash FlowsâIndirect Method | ||||
| Operating activities: | ||||
| Net income | $ | 41,500 | ||
| Adjustments to convert net income to cash basis: | ||||
| Depreciation | $ | 20,100 | ||
| Increase in accounts receivable | (61,500) | |||
| Increase in inventory | (25,100) | |||
| Decrease in prepaid expenses | 9,400 | |||
| Increase in accounts payable | 54,300 | |||
| Decrease in accrued liabilities | (10,100) | |||
| Increase in income taxes payable | 3,300 | (9,600) | ||
| Net cash provided by operating activities | 31,900 | |||
| Investing activities: | ||||
| Proceeds from the sale of equipment | 15,200 | |||
| Loan to Thomas Company | (41,900) | |||
| Additions to plant and equipment | (121,800) | |||
| Net cash used for investing activities | (148,500) | |||
| Financing activities: | ||||
| Increase in bonds payable | 88,800 | |||
| Increase in common stock | 38,700 | |||
| Cash dividends | (28,400) | |||
| Net cash provided by financing activities | 99,100 | |||
| Net decrease in cash | (17,500) | |||
| Beginning cash balance | 27,200 | |||
| Ending cash balance | $ | 9,700 | ||
| Required: |
| Compute Apex Companyâs free cash flow for the current year. (Negative amount should be indicated by a minus sign.) |
Free Cash Flow
5.
| For the just completed year, Hanna Company had net income of $95,000. Balances in the companyâs current asset and current liability accounts at the beginning and end of the year were as follows: |
| December 31 | ||||
| End of Year | Beginning of Year | |||
| Current assets: | ||||
| Cash | $ | 59,000 | $ | 80,000 |
| Accounts receivable | $ | 164,000 | $ | 184,000 |
| Inventory | $ | 448,000 | $ | 346,000 |
| Prepaid expenses | $ | 11,500 | $ | 15,000 |
| Current liabilities: | ||||
| Accounts payable | $ | 366,000 | $ | 392,000 |
| Accrued liabilities | $ | 8,000 | $ | 13,000 |
| Income taxes payable | $ | 32,000 | $ | 25,000 |
| The Accumulated Depreciation account had total credits of $42,000 during the year. Hanna Company did not record any gains or losses during the year. |
| Required: |
| Use the indirect method to determine the net cash provided by (or used in) operating activities for the year. (List any deduction in cash and cash outflows as negative amounts.) |
