INFO 2020 Lecture 4: Week 4-6 Notes

7 Feb 2017
School
Department
Course
Professor
Document Summary
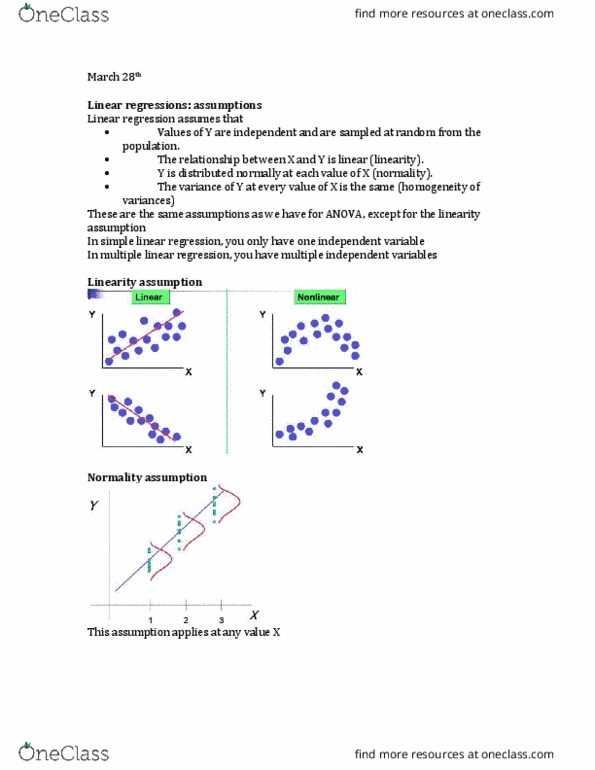
Scatter plots dv on left iv bottom. Correlations doesn"t matter if they are bad, just need to interpret it correct. Standardized residuals should be between -2 and 2 if good model. Residuals should be identically distributed: normally distributed. What to do with new data: data cleaning, exploration, descriptive stats, histograms, correlations, scatter plots, regression. What is bad: depends on industry, strong maybe . 7 or more, no correlation . 1 or less. I can predict 77% of the change in my dependent variable based on changes in my independent variable: 77% is predicted, 23% is error. If <0. 05 then we have good model: equations above. Talk in detail about remodel transformation of 1st variable. Next few: original r^2, new, etc, (cid:498)and for the next 5 variables, i did a similar transformation(cid:499, what variables come out, and which are transformed. Final model: talk in detail, our final model has an adjusted r^2 of ###.