ECON 201 Lecture Notes - Lecture 2: Annual Percentage Rate, Aggregate Demand, Government Budget Balance

5 Sep 2018
School
Department
Course
Professor
ECON 201 verified notes
2/30View all

Document Summary
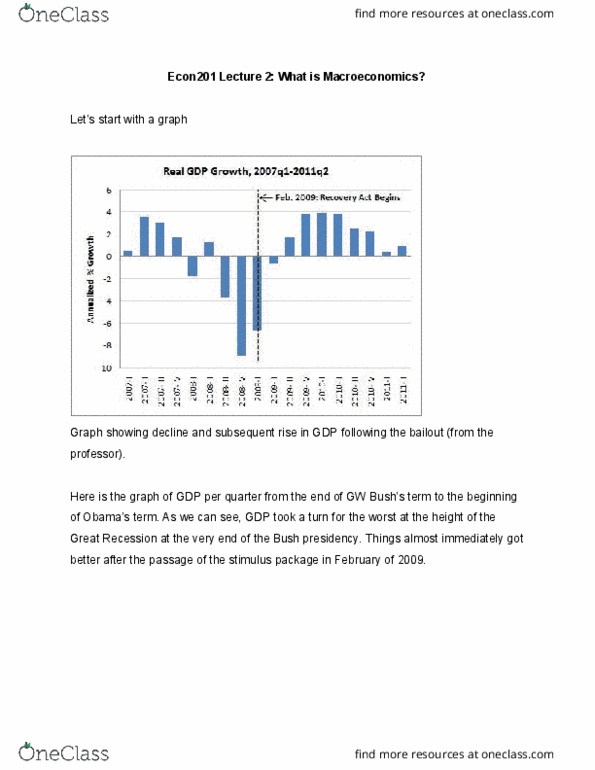
Graph showing decline and subsequent rise in gdp following the bailout (from the professor). Here is the graph of gdp per quarter from the end of gw bush"s term to the beginning of obama"s term. As we can see, gdp took a turn for the worst at the height of the. Great recession at the very end of the bush presidency. Things almost immediately got better after the passage of the stimulus package in february of 2009. Graph showing the steady decline in interest rates (taken from google) Interest rate- ihe amount charged, expressed as a percentage of principal, by a lender to a borrower for the use of assets. Interest rates are typically noted on an annual basis, known as the annual percentage rate (apr). This is one very important difference to make. Fun fact: people who can teach macro can also teach micro but not the other way around! (neri, 2018)