ECON 201 Lecture Notes - Lecture 18: Aggregate Supply, Equilibrium Point, Potential Output

26 Oct 2018
School
Department
Course
Professor
ECON 201 verified notes
18/30View all

Document Summary
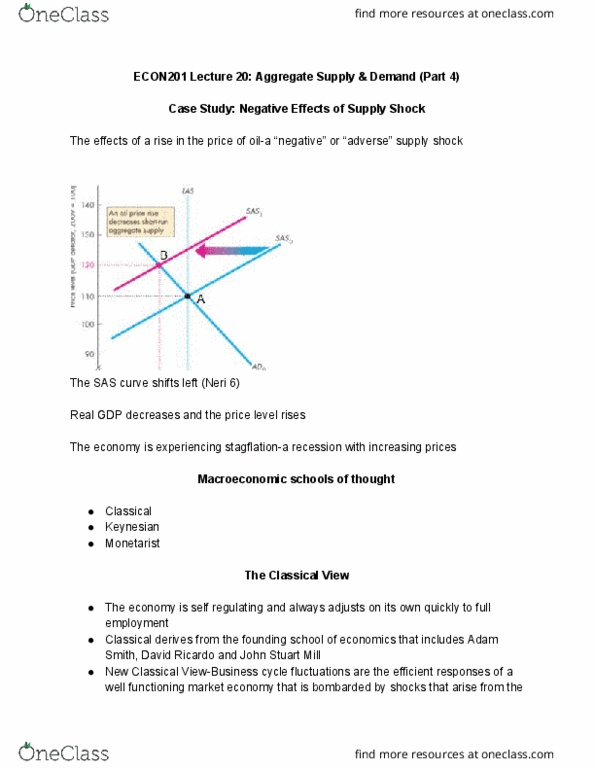
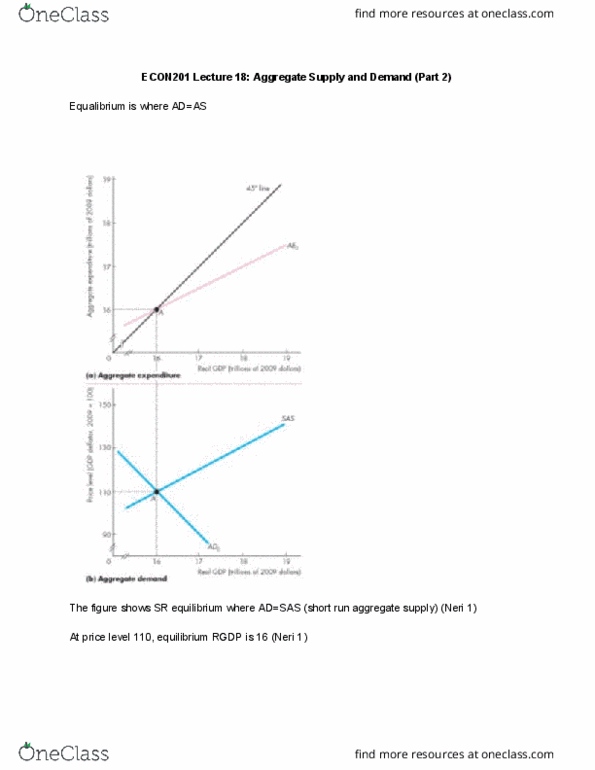
Econ201 lecture 18: aggregate supply and demand (part 2) The figure shows sr equilibrium where ad=sas (short run aggregate supply) (neri 1) At price level 110, equilibrium rgdp is 16 (neri 1) Multiplier and price level in the short run. In chapter 11, we derived the multiplier assuming p is fixed. Now we allow p to vary in the short run. For example, we know an increase in investment shifts the ae curve upward and shifts the ad curve rightward. With no change in the price level, real gdp would be 18 trillion at point b (neri 2) But we can see the price level rises. As the price level rises, real gdp increases along the sas curve to . 3 trillion. The multiplier in the short run is smaller when the price level is fixed. Multiplier and price level in the long run. At point c in b, there is a 1. 3 trillion dollar gap (neri 3)