ECON 201 Lecture Notes - Lecture 22: Phillips Curve, Deflation, Edmund Phelps

Document Summary
Get access


Related Documents
Related Questions

Which of the following statements has been proposed as a benefit of passive policy making?
| Passive policy making utilizes the rational expectations hypothesis. | ||
| Passive policy making allows for making immediate changes in response to an anticipated change in economic performance. | ||
| When using passive policy making there is no tradeoff between price stability and unemployment. | ||
| Passive policy making does not wait for the time lag between recognition of a problem and policy action before engaging in economic policies to stabilize the economy. |
1.47 points
QUESTION 6
The idea of policy making taking place in response to a predetermined set of rules is referred to as
| discretionary policy making. | ||
| passive policy making. | ||
| Keynesianism. | ||
| active policy making. |
1.47 points
QUESTION 7
What types of unemployment will still exist when the economy is at the natural rate of unemployment?
| frictional and cyclical unemployment only | ||
| frictional, structural, and cyclical unemployment | ||
| frictional and structural unemployment only | ||
| structural and cyclical unemployment only |
1.47 points
QUESTION 8
The natural rate of unemployment is
| the unemployment rate that exists in long-run equilibrium, after adjustments to all changes have occurred. | ||
| the unemployment rate when there is no structural unemployment. | ||
| the unemployment rate when there is no structural or cyclical unemployment. | ||
| zero. |
1.47 points
QUESTION 9
According to the text, minimum-wage laws cause increases in
| employment possibilities. | ||
| structural unemployment. | ||
| poverty. | ||
| productivity. |
1.47 points
QUESTION 10
During a recession, the overall unemployment rate
| exceeds the natural rate of unemployment. | ||
| falls below the natural rate of unemployment. | ||
| falls rapidly. | ||
| equals the inflation rate. |
1.47 points
QUESTION 11
Cyclical unemployment is
| the unemployment due to the unemployment benefits and welfare programs of the government. | ||
| the unemployment due to union activities and government-imposed restrictions to entry into specific occupations. | ||
| the difference between the actual unemployment rate and the natural rate of unemployment. | ||
| the difference between the unemployment rate when the economy is in a recession and the unemployment rate when the economy is at the peak of an expansion. |
1.47 points
QUESTION 12
Which of the following unemployment rates can be negative?
| the natural unemployment rate | ||
| the seasonal unemployment rate | ||
| the official unemployment rate reported by the Bureau of Labor Statistics | ||
| the cyclical unemployment rate |
1.47 points
QUESTION 13
An unexpected increase in aggregate demand typically causes
| the price level to increase but has no effect on the unemployment rate. | ||
| frictional unemployment to increase but structural unemployment to decrease. | ||
| the price level to increase and the unemployment rate to fall. | ||
| the price level to increase and the unemployment rate to increase. |
1.47 points
QUESTION 14
The rate of unemployment below which the rate of inflation tends to rise and above which the rate of inflation tends to fall is known as the
| non-accelerating-inflation rate of unemployment (NAIRU). | ||
| contrary rate of unemployment. | ||
| Phillips rate of unemployment. | ||
| menu cost rate of unemployment. |
1.47 points
QUESTION 15
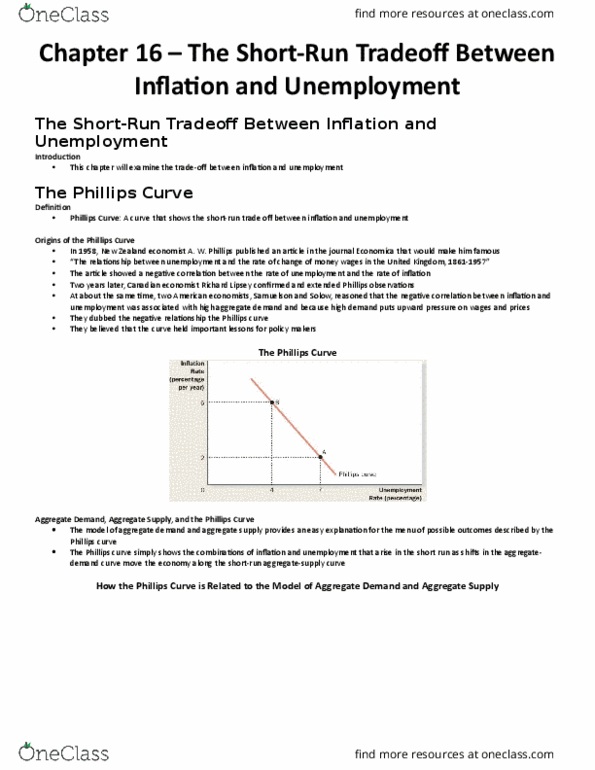
Based on the work of economist A.W. Phillips, economists concluded that
| high inflation rates are associated with low unemployment rates. | ||
| higher rates of inflation are associated with higher rates of unemployment. | ||
| there is no trade-off between inflation and unemployment. | ||
| unemployment can be effectively combated by raising wages. |
1.47 points
QUESTION 16
What happens to the Phillips curve when the expected rate of inflation rises?
| The curve shifts to the right | ||
| The curve shifts to the left | ||
| The Phillips curve is unaffected | ||
| The curve becomes horizontal |
1.47 points
QUESTION 17
The short-run Phillips curve suggests what policy making implications?
| Passive policy making is more effective than active policy making. | ||
| Active policy making does not yield any predictable results. | ||
| Maintaining both the inflation and unemployment rates at low levels is possible if policy makers will rely solely on nondiscretionary policy making. | ||
| Using discretionary policies, it may be possible to achieve just the right unemployment and inflation mix. |
1.47 points
QUESTION 18
We observe the duration of unemployment falling and wage rates rising. It is likely that
| aggregate supply has increased. | ||
| aggregate demand has increased. | ||
| summer has arrived. | ||
| the government has initiated expansionary fiscal policy but the policies haven't taken effect yet. |
1.47 points
QUESTION 19
Policymakers' attempts to use the Phillips curve to reduce the unemployment rate below the natural rate
| will be successful since the Phillips curve shows the relationship between the inflation rate and the unemployment rate. | ||
| will be unsuccessful if monetary policy is used since monetary policy leads to higher prices. | ||
| will be successful if monetary policy is used. | ||
| will be unsuccessful since workers' expectations adjust to attempts to reduce unemployment below the natural rate. |
1.47 points
QUESTION 20
Which one of the following would likely reduce the level of structural unemployment?
| strengthening restrictions on who can be licensed to enter certain professions | ||
| increasing the minimum wage to encourage more people to work | ||
| increasing the level of union bargaining power | ||
| limiting unemployment insurance benefits |
1.47 points
QUESTION 21
An unexpected decrease in aggregate demand
| will decrease real GDP, but will not affect the rate and duration of unemployment. | ||
| will decrease the price level. | ||
| will decrease long-run aggregate supply. | ||
| will decrease the average duration of unemployment. |
1.47 points
QUESTION 22
When a person bases her future expectations for the economy on all available current data and her own judgment about future policy effects, this is known as
| rational expectations. | ||
| irrational expectations. | ||
| the policy irrelevance proposition. | ||
| the new classical theory. |
1.47 points
QUESTION 23
According to the rational expectations hypothesis, monetary policy can have real effects on such variables as real Gross Domestic Product (GDP) in the short run
| when the Federal Reserve's open market committee operates as expected in either buying or selling bonds. | ||
| regardless of whether the policy is anticipated or unanticipated. | ||
| only when the policy is unsystematic and unanticipated. | ||
| only when the policy is anticipated. |
1.47 points
QUESTION 24
Rational expectations theory suggests that short-run stabilization policy
| should not be attempted. | ||
| is best achieved with fiscal policy. | ||
| is best achieved with monetary policy. | ||
| is equally easy to achieve with monetary or fiscal policy. |
1.47 points
QUESTION 25
Proponents of the policy irrelevance proposition believe that, under the assumption of rational expectations, the unemployment rate will
| go down whenever the Fed announces an anticipated fiscal policy change. | ||
| equal the natural rate of unemployment in the long run, regardless of any monetary policy actions. | ||
| always be higher in the long run than the natural rate of employment. | ||
| go up whenever the Fed announces an anticipated monetary policy change. |
1.47 points
QUESTION 26
For the policy irrelevance theorem to hold, people must
| not persistently make the same mistakes in forecasting the future. | ||
| know exactly what the Fed is planning to do. | ||
| know the future perfectly. | ||
| never make mistakes in their forecasts, even when they do not know the future perfectly. |
1.47 points
QUESTION 27
According to the policy irrelevance proposition, the impact of an anticipated expansionary monetary policy will be to
| increase the price level in the long run. | ||
| increase the real Gross Domestic Product (GDP) in the long run. | ||
| decrease the natural rate of unemployment. | ||
| decrease the price level and the unemployment rate. |
1.47 points
QUESTION 28
One key assumption lying behind the policy irrelevance proposition is that
| prices are "sticky" upward. | ||
| wages are "sticky" downward. | ||
| markets are not purely competitive. | ||
| the rational expectations hypothesis is correct. |
1.47 points
QUESTION 29
According to the real business cycle theory, an increase in an input price, such as oil, will
| increase both real Gross Domestic Product (GDP) and the price level. | ||
| increase real Gross Domestic Product (GDP) but not change the price level. | ||
| decrease both real Gross Domestic Product (GDP) and the price level. | ||
| decrease real Gross Domestic Product (GDP) but increase the price level. |
1.47 points
QUESTION 30
When "stagflation" occurs,
| the economy experiences higher inflation rates and higher unemployment rates at the same time. | ||
| the economy experiences lower inflation rates and higher unemployment rates at the same time. | ||
| the economy experiences higher inflation rates and lower unemployment rates at the same time. | ||
| the economy experiences lower inflation rates and lower unemployment rates at the same time. |
1.47 points
QUESTION 31
When a supply shock is permanent
| only the short-run aggregate supply curve shifts leftward. | ||
| only the long-run aggregate supply curve shifts leftward. | ||
| there are no shifts in either the long-run or short-run aggregate supply curve. | ||
| both the long-run and short-run aggregate supply curves shift leftward. |
1.47 points
QUESTION 32
According to economists who promote sticky-price theories,
| only monetary policy is an effective stabilization policy. | ||
| only fiscal policy is an effective stabilization policy. | ||
| both fiscal and monetary policy can be effective stabilization policies. | ||
| neither fiscal nor monetary policy is an effective stabilization policy. |
1.47 points
QUESTION 33
Some economists suggest that because of the costs of negotiating contracts, printing price lists, etc., it is costly for firms to change prices in response to demand changes. This hypothesis is known as the
| menu cost theory. | ||
| Phillips theory. | ||
| Freidman theory. | ||
| sticky wage theory. |
1.47 points
QUESTION 34
The menu cost theory suggests that
| wages and prices move freely and quickly. | ||
| there will be no unemployment. | ||
| firms find frequent price changes to be costly. | ||
| the economy is characterized only by perfect competition. |
1.47 points
QUESTION 35
In new Keynesian theory, the pattern of inflation exhibited by an economy with growing aggregate demand known as inflation dynamics is
| initially speedy upward adjustment of the price level and inflation in response to higher aggregate demand followed by lower inflation in the future. | ||
| initially sluggish downward adjustment of the price level and inflation in response to higher aggregate demand followed by lower inflation in the future. | ||
| initially sluggish upward adjustment of the price level and inflation in response to higher aggregate demand followed by higher inflation in the future. | ||
| initially speedy upward adjustment of the price level and inflation in response to higher aggregate demand followed by higher inflation in the future. |
1.47 points
QUESTION 36
Menu costs are a possible reason for
| swings in the labor force participation rate. | ||
| sticky product prices. | ||
| aggregate supply shocks. | ||
| low levels of consumer confidence in response to aggregate supply shocks. |
1.47 points
QUESTION 37
New Keynesians hypothesize that
| the relationship between inflation and unemployment is exploitable in the short run. | ||
| fluctuations in output are largely caused by supply shocks. | ||
| the relationship between inflation and unemployment is exploitable in the long run. | ||
| there is no relationship between inflation and unemployment. |
1.47 points
QUESTION 38
Economists Milton Friedman and E.S. Phelps suggested that the apparent trade-off suggested by the Phillips curve could not be exploited by policy makers, because
| unemployment levels and the inflation rate have a negative (inverse) relationship. | ||
| unemployment levels and the inflation rate have a clear, positive relationship. | ||
| economic participants routinely incorporate changes in the inflation rate into their expectations. | ||
| economic participants are not rational, and therefore act unpredictably to any policy change. |
1.47 points
QUESTION 39
When it comes to active policy making most economists agree that
| it is unlikely that active policy making will have any long term effects on the economy. | ||
| it will lead to long term shocks in the system. | ||
| it is likely that active policy making will have long term effects on the economy. | ||
| active policy making should be used over passive policy making. |
1.47 points
QUESTION 40
If population growth occurs while jobs are difficult to obtain or labor force participation does not increase,
| economic growth will be robust because any population gain is a plus. | ||
| per capita GDP is likely to increase sharply. | ||
| there may be little or no increase in a nation's labor resources. | ||
| a nation's labor resources will still continue to increase in both quality and quantity. |
1.47 points
QUESTION 41
If the level of aggregate real Gross Domestic Product (GDP) remains constant, a reduction in the population
| indirectly reduces per capita real GDP. | ||
| directly reduces per capita real GDP. | ||
| directly increases per capita real GDP. | ||
| has no effect on real per capita real GDP. |
1.47 points
QUESTION 42
Suppose a nation's real Gross Domestic Product (GDP) grows at a constant rate of 5 percent per year while its population grows 2 percent annually. Given this information, this nation's annual rate of per capita real GDP growth is approximately equal to
| 2 percent | ||
| 1 percent | ||
| 5 percent | ||
| 3 percent |
1.47 points
QUESTION 43
In the determination of economic growth, political freedom
| is equally as important as economic freedom. | ||
| appears to be less important than economic freedom. | ||
| contributes little to job growth. | ||
| is more important than economic freedom. |
1.47 points
QUESTION 44
Political freedom can sometimes moderately reduce economic growth because
| special interest groups may gain at the expense of the overall economy. | ||
| campaign contributions rob the economy of investment. | ||
| most jobs are in unions that are politically connected. | ||
| none of the above. |
1.47 points
QUESTION 45
Economic freedom is
| the right to own private property and to exchange goods with minimal government interference. | ||
| present as long as private individuals own businesses. | ||
| the amount of control that the government has in a market. | ||
| the right to vote in an election for a political leader. |
1.47 points
QUESTION 46
The right to openly support and democratically select national leaders is
| population freedom. | ||
| political freedom. | ||
| economic freedom. | ||
| capital freedom. |
1.47 points
QUESTION 47
Economic growth is measured by
| the annual percentage change in nominal GDP. | ||
| the annual percentage change in per capita real GDP. | ||
| the annual percentage change in per capita nominal GDP. | ||
| the annual percentage change in the unemployment rate. |
1.47 points
QUESTION 48
Laws that make it difficult to start a new business lead to a
| laissez-faire. | ||
| low rate of economic growth. | ||
| high rate of economic growth. | ||
| more political freedom. |
1.47 points
QUESTION 49
Dead capital is
| any capital resource that lacks clear title of ownership. | ||
| machinery that requires constant maintenance. | ||
| machinery that fails to operate properly. | ||
| a capital resource that depreciates rapidly. |
1.47 points
QUESTION 50
The significance of dead capital is that
| it is being removed from its most efficient use. | ||
| it is difficult to allocate to its most efficient use. | ||
| its fixed cost is too high. | ||
| it replaces too many workers. |
1.47 points
QUESTION 51
Developing countries are damaged by dead capital because
| it replaces too many workers, creating unemployment. | ||
| resulting inefficiencies greatly reduce the rate of return on investment. | ||
| it must be sold as scrap. | ||
| none of the above. |
1.47 points
QUESTION 52
The role that dead capital plays in a country's economic growth is that
| growth neither increases nor is impaired by dead capital. | ||
| growth increases because the dead capital is replaced with more technologically efficient capital. | ||
| growth increases since the firms using the dead capital are using it for free. | ||
| growth is impaired since the capital cannot be allocated to its most efficient use. |
1.47 points
QUESTION 53
When government inefficiencies exist,
| a country tends to grow at a faster rate. | ||
| economic growth is not influenced. | ||
| dead capital is usually not a problem. | ||
| a country tends to grow at a slower rate. |
1.47 points
QUESTION 54
The acquisition of more than 10 percent of the shares of ownership in a company in another nation is called
| gross private international investment. | ||
| majority investment. | ||
| foreign direct investment. | ||
| portfolio investment. |
1.47 points
QUESTION 55
Most international investment finance today comes from
| portfolio and foreign direct investment. | ||
| the sale of antiques. | ||
| government financing. | ||
| tax collections. |
1.47 points
QUESTION 56
Portfolio investment means buying
| livestock. | ||
| less than 10 percent ownership in a foreign company. | ||
| a life insurance policy when traveling abroad. | ||
| more than 50 percent ownership in a foreign company. |
1.47 points
QUESTION 57
The primary motivation for private foreign investment in developing nations is
| to eradicate poverty. | ||
| to improve the standard of living for workers. | ||
| the potential for high rates of return. | ||
| to do research in countries with fewer social regulations. |
1.47 points
QUESTION 58
An international financial crisis is most often caused by
| a nation's central bank lowering domestic interest rates. | ||
| a drop in the value of the U.S. dollar. | ||
| foreign investments and loans being withdrawn from a nation. | ||
| a government refusing to pay its dues to the United Nations. |
1.47 points
QUESTION 59
Adverse selection is a barrier to financing global growth because
| there is the possibility that the funds are used for riskier behavior than the lender agreed to. | ||
| firms sometimes have trouble determining whether they need funds or not. | ||
| if investors have trouble identifying high-risk firms they may be unwilling to lend funds to creditworthy firms. | ||
| of the differences between financing using loans, portfolio investment and foreign direct investment. |
1.47 points
QUESTION 60
Moral hazard is a barrier to financing global growth because
| there is the possibility that the funds are used for riskier behavior than the lender agreed to. | ||
| if investors have trouble identifying high-risk firms they may be unwilling to give money to creditworthy firms. | ||
| firms sometimes have trouble determining whether they need funds or not. | ||
| of the differences between financing using loans, portfolio investment and foreign direct investment. |
1.47 points
QUESTION 61
Two types of asymmetric information that create problems for international investment are
| adverse hazard and moral selection. | ||
| adverse hazard and moral hazard. | ||
| adverse selection and moral selection. | ||
| adverse selection and moral hazard. |
1.47 points
QUESTION 62
The multinational agency that specializes in making loans to developing nations in an effort to promote long-term development and growth is the
| International Monetary Fund. | ||
| United Nations Development Program. | ||
| World Trade Organization. | ||
| World Bank. |
1.47 points
QUESTION 63
The multinational organization that aims to promote world economic growth by fostering financial stability is the
| World Bank. | ||
| United Nations. | ||
| International Monetary Fund. | ||
| World Trade Organization. |
1.47 points
QUESTION 64
A nation's account with the IMF is called its
| deposit surplus. | ||
| capital account. | ||
| current account. | ||
| quota subscription. |
1.47 points
QUESTION 65
The international unit of accounting used by the International Monetary Fund (IMF) is called
| the Eurodollar. | ||
| the IMF dollar. | ||
| the quota subscription. | ||
| special drawing rights. |
1.47 points
QUESTION 66
The International Monetary Fund (IMF) was created to achieve each of the following goals EXCEPT
| to supervise exchange-rate practices of member countries. | ||
| to help finance economic development in poor countries. | ||
| to encourage convertibility of member countries' currencies. | ||
| to lend funds to countries having difficulties meeting their international payment obligations. |
1.47 points
QUESTION 67
The World Bank specializes in making loans to promote
| short-term assistance when a nation experiences a financial crisis. | ||
| financial stability. | ||
| so-called stand-by arrangements and credits. | ||
| long-term development and growth. |
1.47 points
QUESTION 68
The International Monetary Fund
| is the bank that causes international financial crisis when the reserves are too high. | ||
| is a central bank like the Federal Reserve System. | ||
| is a multinational organization that aims to promote world economic growth through more financial stability. | ||
| is a multinational agency that specializes in making loans to promote long-term development and growth in developing countries. |

