ECON 203 Lecture Notes - Lecture 16: Xm Satellite Radio, Aggregate Demand, Aggregate Supply
43 views6 pages

Document Summary
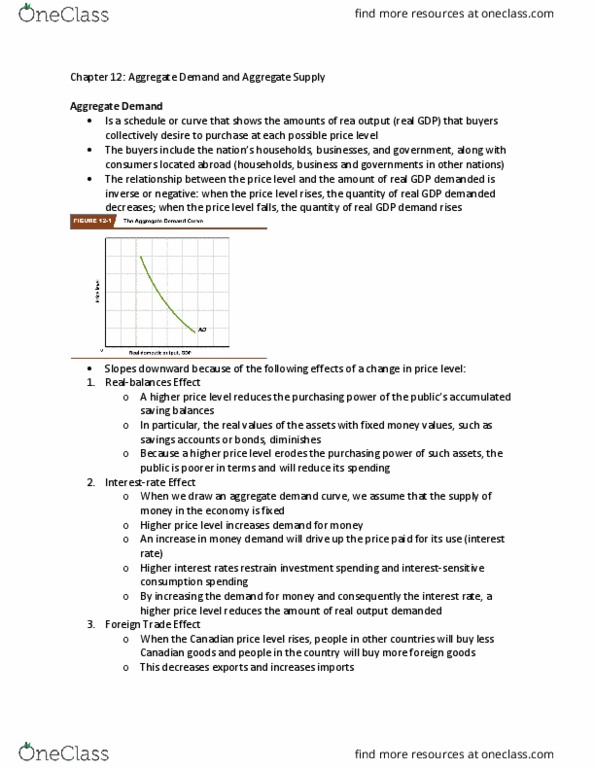
Last week of class will be review: no need to attend if not taking the final exam. The curve that shows the level of real gdp purchased by households (c), firms (i), government (g), and the rest of the world (nx) at different price levels. The vertical axis measures the average price of goods and services on the economy using the cpi (won"t be tested on) The horizontal axis measures the value of gdp. (won"t be tested on) Decrease in the price level: increase in the real gdp demanded. Increase in the price level: decrease in the real gdp demanded. Why does the aggregate demand curve slope downward to the right? i. Consumption (c) (c+i+g+nx) = ad and vice-versa. Buying power of dollars obviously goes down when the price of something increases. Inverse relationship between price level and aggregate demand.
Get access
Grade+20% off
$8 USD/m$10 USD/m
Billed $96 USD annually

Homework Help
Study Guides
Textbook Solutions
Class Notes
Textbook Notes
Booster Class
40 Verified Answers
Class+
$8 USD/m
Billed $96 USD annually

Homework Help
Study Guides
Textbook Solutions
Class Notes
Textbook Notes
Booster Class
30 Verified Answers