POL 51 Lecture 11: Lecture 11

Document Summary
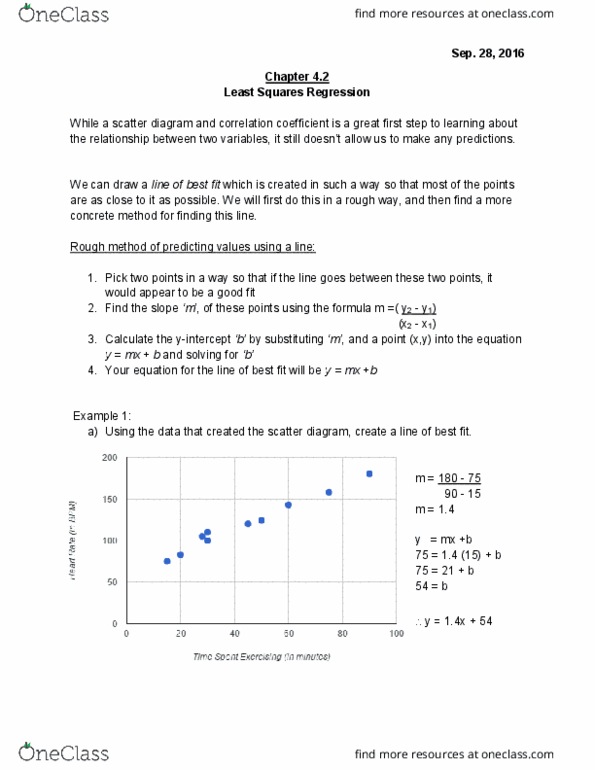
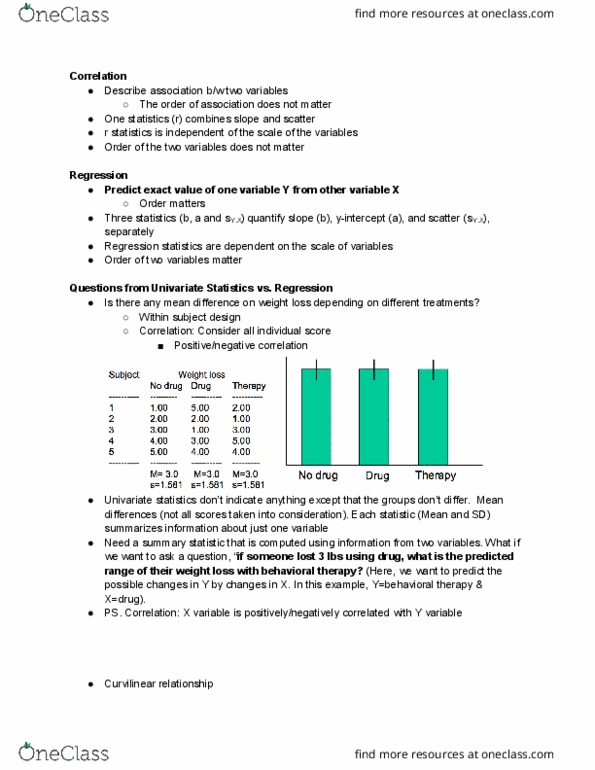
How do we fit a line to scatter plots, data, etc. to come up w/a model. Bc we want a sense of how a change in iv affects dv. We want to know how much a change affects this relationship. The line is a statistical model of reality. Fitting the best line through a scatter plot. Equation of a line: y = mx + b. For one-unit increase in x, m is the corresponding rise in y. Population regression model: yi = + xi + ui is the predicted value of y when x=0. Same equation as the equation of a line, but with different symbols. + xi = systematic component captures some relationship between variables. Gives us the points on the line ui = stochastic ( random ) component of our dependent variable. Other points that don"t fall on the line. Captures the other stuff that isn"t captured by the systematic component.