ECON 100A Lecture Notes - Lecture 7: Hypotenuse, Standard Deviation, Scatter Plot

Document Summary
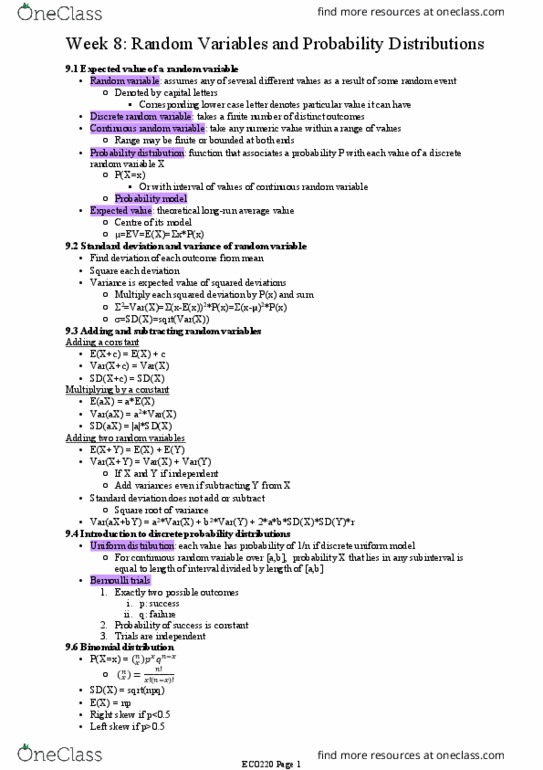
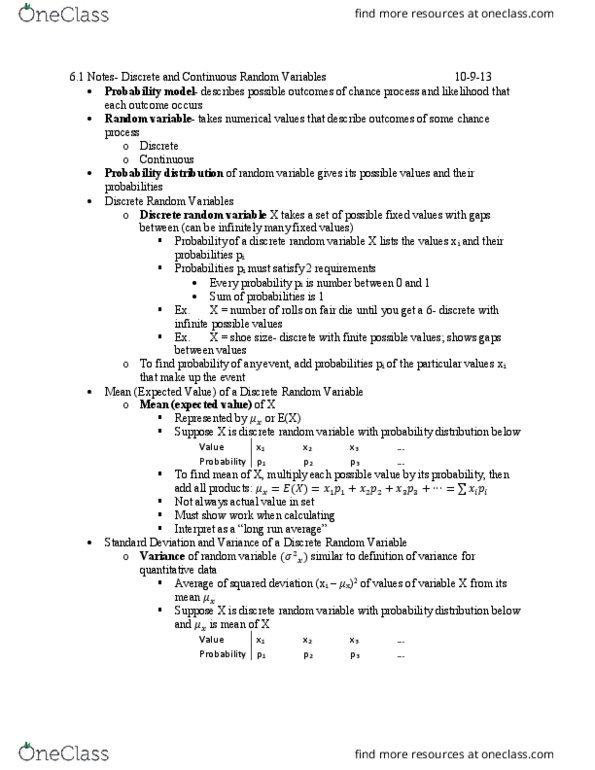
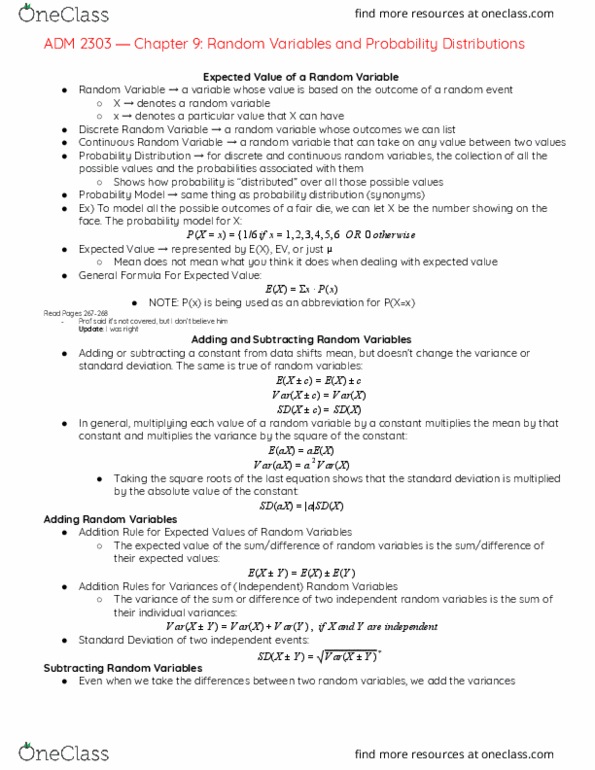
Discussion seven (11/8/16) random variables are usually capitalized. Map each outcome to an x value. Probability distribution (graph): each height should add up to 1. Parameters are the answers to the questions we ask. Mean is called expected value (what you expect to happen during this random process) take each value and weigh it by its probabilities (add all these up) Standard deviation: take each value, subtract the mean (expected value) square that and then multiply the probabilities. Area under the curve is 1 for a continuous random variable. Mean of continuous random variables integral of p(x) Similar to finding expected value for variance, it"s x^2. We shift expected value as well; spread/variance has not changed at all in general: e(x+c)=e(x)+c. Effect of multiplying by a constant on dispersion. Test: probability table with outskirt probabilities but nothing in middle. X and y are independent -> multiply the outskirt probabilities together.