STA 2023 Lecture Notes - Lecture 26: Standard Deviation, Sampling Distribution, Confidence Interval

Document Summary
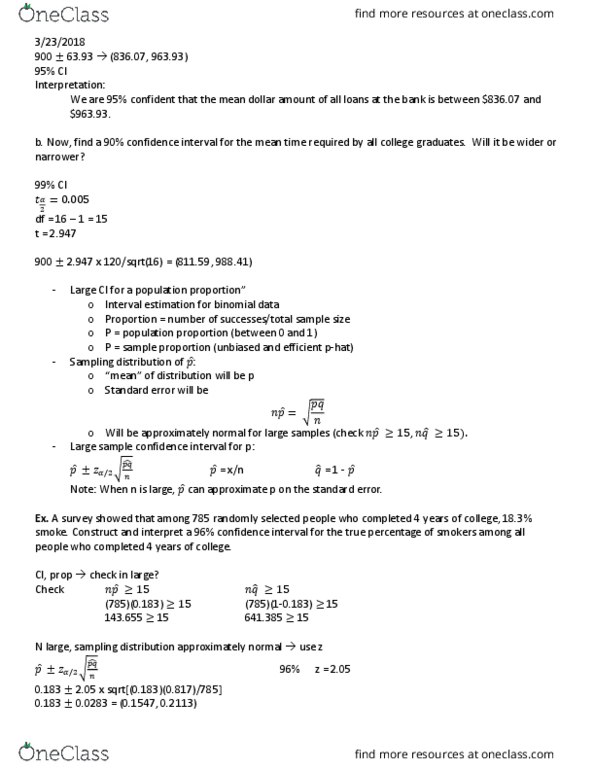
7. 3 ci for a populatio(cid:374) (cid:373)ea(cid:374): stude(cid:374)t"s t statistics. 2 problems with a small sample: shape of sampling distribution now depends on the population that is sampled. Solution: if the original population is approximately normal, then the sampling distribution is normal: s may not be a good estimation of . Solution: use the student t distribution instead of z distribution. ***t statistics is more variable than z statistics. (cid:1872)= (cid:1871) . There are many more distributions to choose from depending on your degree of freedom (df = n-1) As n , t z (that is why the number at the bottom of the t table match critical values of z. Note: degrees of freedom if 3 test scores have a mean of 80, 2 can be free but the third must be (80*3 the other two). 900 63. 93 = (836. 07, 963. 93) df = 15.