STATS 10 Lecture Notes - Lecture 9: Probability Distribution, Normal Distribution, Random Variable

Document Summary
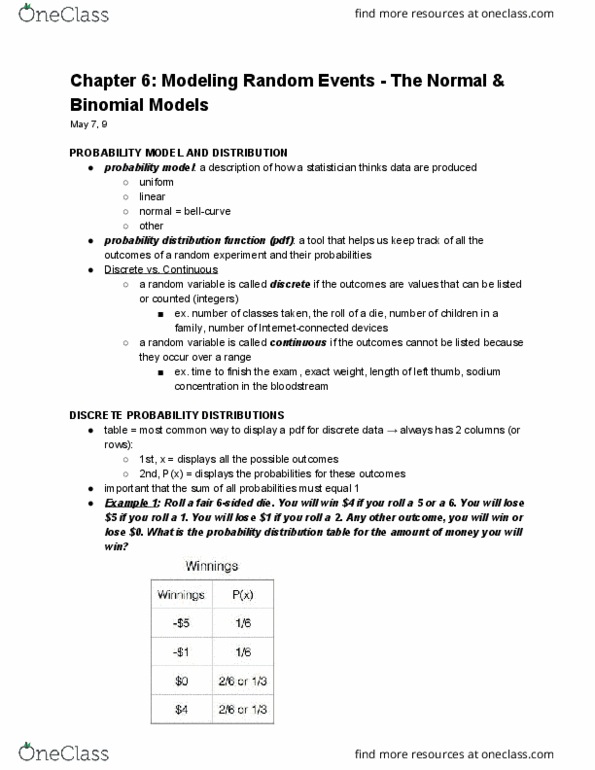
Modeling random events: the normal and binomial models. A probability model is a description of how a statistician thinks data are produced. A probability distribution or probability distribution function (pdf) is a tool that helps us keep track of all the outcomes of a random experiment and their probabilities. A random variable is called discrete if the outcomes are values that can be listed or counted. (whole numbers) A random variable is called continuous if the outcomes cannot be listed because they occur over a range. (decimal points/fractions) Classify the following as discrete or continuous: Number of children in a family: discrete. Number of devices in the house that connect to the internet: discrete. The most common way to display a probability distribution function (pdf) for discrete data is with a table. The probability distribution table always has two columns (or rows) The first, x, displays all the possible outcomes. The second, p(x), displays the probabilities for these outcomes.