STATS 10 Lecture Notes - Lecture 6: General Idea, Linear Model, Scatter Plot

Document Summary
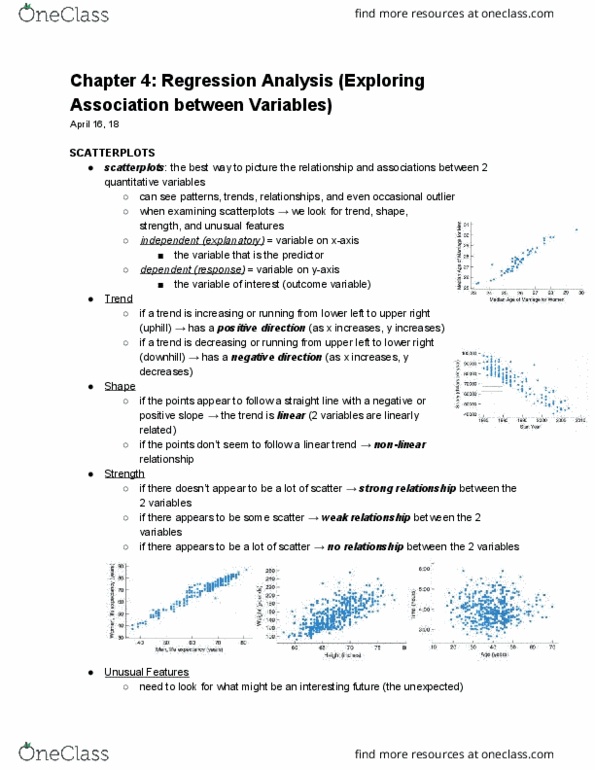
Chapter 3: describe a numerical variable"s center and spread when its distribution is symmetric/skewed. Chapter 4: linear relationship between two numerical variables using statistics and a linear equation. Can see patterns, trends, relationships, and sometimes outliers. explanatory/independent variable : x-axis variable response/dependent variable : y-axis variable. From lower left to upper right is positive (x+, y+) From upper left to lower right is negative (x+, y-) If the points look like they"re stretched out generally and consistently in a straight form , the relationship is linear . Single outliers or clusters / subgroups should be noted. Pearson"s correlation coefficient , gives us numerical measurement of strength of linear relationship. 1 r 1, with -1 negative, 1 positive, 0 no relationship. The important thing here is to identify patterns. Z-score: number of standard deviations away from the mean. You can have patterns or clusters but no correlation. Mean tells center of data in terms of the axes.