COMM 88 Lecture Notes - Lecture 11: Call Screening, Tinder, Semantic Differential


Comm 88 Lecture 10
May 8, 2018
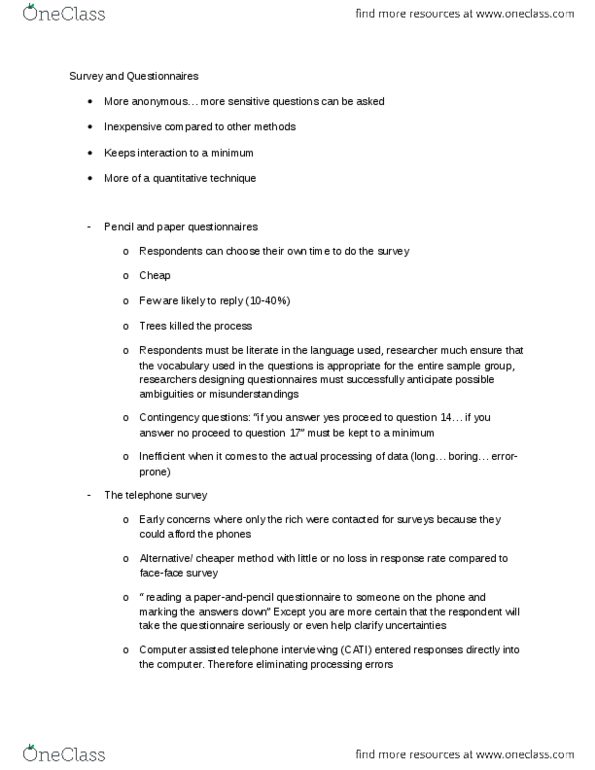
•Administering surveys (cont,)
•Interview surveys
•Telephone
•Quickest results
•Compared to face-to-face: reduced costs, more privacy, more efficiency
•Compared to self-administered: more detail possible, better response rate
•But what about call screening and cell phones?
•Experience sampling
•Send text messages to participants, they link via phone to survey online (can also use
survey apps)
•Participants answer questions about their experiences/feelings “in the moment”
•Can improve accuracy of self-reports
•Allows for longitudinal/panel data
•Understanding data in survey research
•Depends on hypotheses and how IVs/DVs are measured
•Examining differences
•Ex: Hyp: Millennials will disclose more online than will people from other generations
•IV: generation - categorical variable
•DV: disclosure - depends how measured…
•IV is categorical (nominal/discrete)
•Ex: Comparing age groups, heavy vs. light talkers, tinder users/non-users
•If DV is also categorical
•All that can be done is to compare percentages in the different categories (typical of
opinion polls)
•Ex: Pew poll on marijuana legalization…IV: generation (age group), DV: support for
legalization (yes/no)
•If DV is continuous (interval or ratio): DV uses Likert, semantic differential items, etc.)
•Compare mean (average) DV scores for the different IV categories
•FYI - this is same analysis done for experiments!
•Ex: IV: generation - separate the age groups, DV: personal disclosures, compare mean
scores for each generation
•Examining continuous relationships
•Ex: Hyp: The more that people talk about their problems, the worse their problems seem
•IV: amount talk about problems - continuous variable
•DV: perceived severity of problems - continuous variable
•Both IV and DV are continuous (interval/ratio data) → compute a correlation
•Correlation - statistical value (r) that shows the relationship between the two (or more)
continuous variables
•r tells you: type (+ vs -) and magnitude (strength) of relationship
•Type of relationship
•Positive (direct) r: as X increases, Y increases
•Negative (inverse) r: as X increases, Y decreases
•Magnitude of relationship (strength)
•r ranges from 0-1: -1.00 ← 0 → +1.00
•The further from 0, the stronger the relationship
•What can you conclude from survey/observational data?