ECON 3A Lecture Notes - Lecture 16: Inventory Turnover, Working Capital, Current Liability
43 views4 pages

Document Summary
Liquidity ratios (how strong are you right now) Measure the short-term ability of the enterprise to pay its maturing obligations and to meet unexpected needs for cash. Short-term creditors such as bankers and suppliers. Solvency ratios (how strong will you be later on) Measure the ability of the enterprise to survive over a long period of time. Long-term creditors and stockholders- particularly with respect to ability to make principle and interest payments. Measure the income or operating success of an enterprise for a given period of. Its ability to obtain debt and equity financing. If extremely profitable, can be both liquid and solvent. Principle valuation of a stock starts with the income statement then compares balance sheet to the market. Why does it make sense to convert items on the statements to per share . Unless you own all the stock of a company, you would like to see activity converted to the basis at which you made your purchase.
Get access
Grade+20% off
$8 USD/m$10 USD/m
Billed $96 USD annually

Homework Help
Study Guides
Textbook Solutions
Class Notes
Textbook Notes
Booster Class
40 Verified Answers
Class+
$8 USD/m
Billed $96 USD annually

Homework Help
Study Guides
Textbook Solutions
Class Notes
Textbook Notes
Booster Class
30 Verified Answers
Related Documents
Related Questions
Problem 3-14
Comprehensive Ratio Analysis
The Jimenez Corporation's forecasted 2014 financial statements follow, along with some industry average ratios.
Jimenez Corporation: Forecasted Balance Sheet as of December 31, 2014
| Assets | |
| Cash | $ 72,000 |
| Accounts receivable | 439,000 |
| Inventories | 894,000 |
| Total current assets | $1,405,000 |
| Fixed assets | 431,000 |
| Total assets | $1,836,000 |
| Liabilities and Equity | |
| Accounts payable | $ 332,000 |
| Notes payable | 100,000 |
| Accruals | 170,000 |
| Total current liabilities | $ 602,000 |
| Long-term debt | 404,290 |
| Common stock | 575,000 |
| Retained earnings | 254,710 |
| Total liabilities and equity | $1,836,000 |
Jimenez Corporation: Forecasted Income Statement for 2014
| Sales | $4,290,000 |
| Cost of goods sold | 3,580,000 |
| Selling, general, and administrative expenses | 370,320 |
| Depreciation and amortization | 159,000 |
| Earnings before taxes (EBT) | $ 180,680 |
| Taxes (40%) | 72,272 |
| Net income | $ 108,408 |
| Per Share Data | |
| EPS | $ 4.71 |
| Cash dividends per share | $ 0.95 |
| P/E ratio of | 5.0 |
| Market price (average) | $ 23.57 |
| Number of shares outstanding | 23,000 |
| Industry Financial Ratios (2013)* | |
| The quick ratio of | 1.0 |
| The current ratio of | 2.7 |
| Inventory turnover** | 7.0 |
| Days sales outstanding*** | 32.0 days |
| Fixed assets turn over** | 13.0 |
| Total assets turnover** | 2.6 |
| Return on assets | 9.1% |
| Return on equity | 18.2% |
| The profit margin on aales of | 3.5% |
| Debt-to-assets ratio | 21.0% |
| Liabilities-to-assets ratio | 50.0% |
| P/E ratio of | 6.0 |
| Price/Cash flow ratio of | 3.5 |
| Market/Book ratio of | 3.5 |
| *Industry average ratios have been constant for the past 4 years. | |
| **Based on year-end balance sheet figures. | |
| ***Calculation is based on a 365-day year. | |
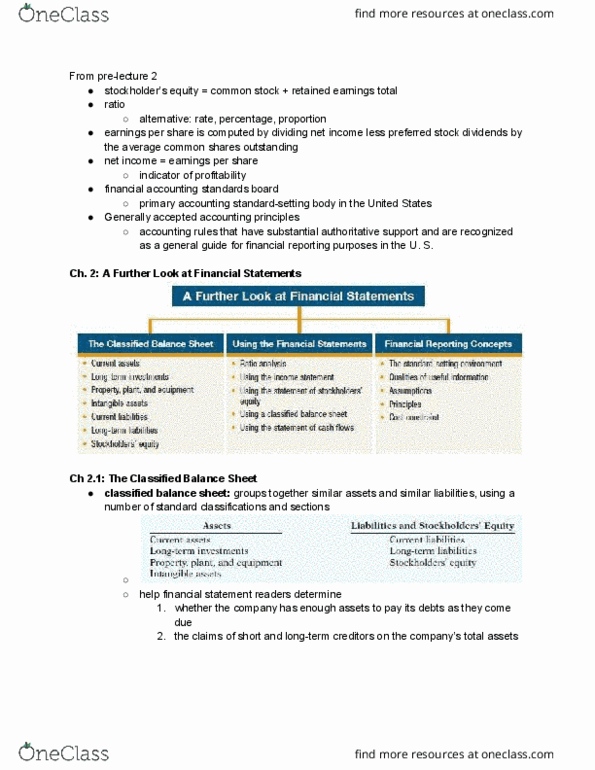
Calculate Jimenez's 2014 forecasted ratios, compare them with the industry average data, and comment briefly on Jimenez's projected strengths and weaknesses. Assume that there are no changes from the prior period to any of the operating balance sheet accounts. Round DSO to the nearest whole number. Round the other ratios to one decimal place.
| Ratios | Firm | Industry | Comment |
| Quick ratio | 1.0 | -Select-Strong Weak Item 2 | |
| Current ratio | 2.7 | -Select-Strong Weak Item 4 | |
| Inventory turnover | 7.0 | -Select-Poor Rich Item 6 | |
| Days sales outstanding | days | 32 days | -Select-Poor Rich Item 8 |
| Fixed assets turnover | 13.0 | -Select-Poor Rich Item 10 | |
| Total assets turnover | 2.6 | -Select-Poor Rich Item 12 | |
| Return on assets | % | 9.1% | -Select-Bad Good Item 14 |
| Return on equity | % | 18.2% | -Select-Bad Good Item 16 |
| The profit margin on sales | % | 3.5% | -Select-Bad Good Item 18 |
| Debt ratio | % | 21.0% | -Select-Low High item 20 |
| Liabilities-to-assets | % | 50.0% | -Select-Low High Item 22 |
| EPS | $4.71 | n.a. | -- |
| Stock Price | $23.57 | n.a. | -- |
| P/E ratio | 6.0 | -Select-PoorRich Item 24 | |
| P/CF ratio | 3.5 | -Select-PoorRich Item 26 | |
| M/B ratio | n.a. | -- |
So, the firm appears to be -Select-badly good item 28 managed

