BME 80H Lecture Notes - Lecture 16: Punnett Square, Epigenetics, Chromatin

11 Jun 2018
School
Department
Course
Professor

Lecture #7- Inheritance of Complex Traits (chapter 5 all)
I. Polygenic (quantitative) Inheritance: when more than one gene contributes
to a phenotype.
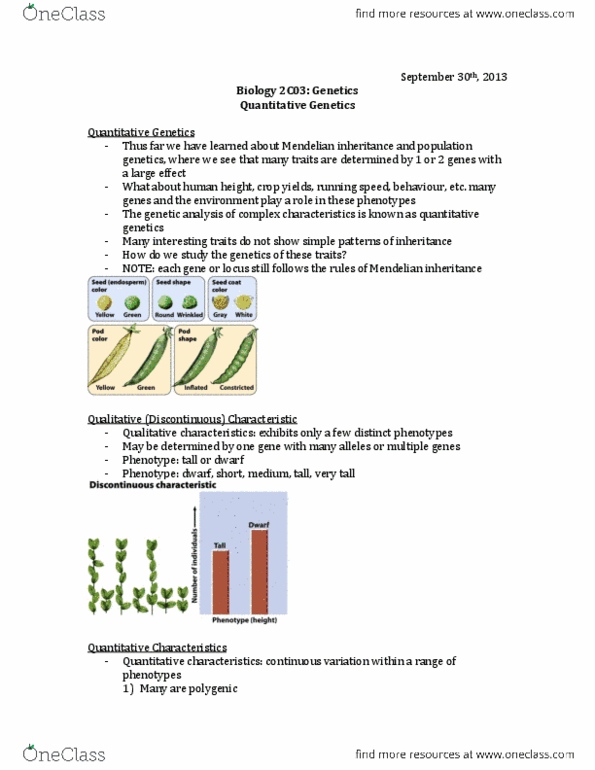
A. Mendelian vs Polygenic Traits (figure 5.1)
A cross of two true-breeding lines:
Mendelian traits (involve a single gene)
F1 show one of the parental traits
F2 phenotypes are distinct = discontinuous variation
Qualitative = description of phenotype
Polygenic traits (involve >1 gene)
F1 show a phenotype intermediate to that of the parents.
F2 show a range of continuously varying phenotypes
Characteristics of Polygenic Inheritance
- quantitative = measured on a scale of numbers
- need large sample sizes, so it is best to use population data
- population = group of individuals in the same species in the same place at
the same time
- not okay to mix different populations in the data
B. The Additive Model for Polygenic Inheritance (Handout, figure 5.5)
- each dominant allele contributes an equal and additive amount to the
phenotype
- recessive alleles contribute nothing
- number of dominant alleles on the x-axis
- uses incomplete dominance, which means you can see a difference in the
variation of expression based on individuals with more dominant alleles
versus less
- each gene has two alleles
- assumes the genes are autosomal (they would only be able to have one in
males if it was on the X)
- does not include the environmental influence
- assumes independent assortment, which means the absence of linkage,
linkage meaning genes located close together on the same chromosome
find more resources at oneclass.com
find more resources at oneclass.com

C. Example cross involving a trait controlled by three genes: A, B and C.
Let’s say the trait is height and, for simplicity sake, let’s assume no
environmental impact.
cross of two persons with medium height:
woman AabbCC x man AABbcc
- woman can produce 2 gametes: AbC or abC
- his 2 gametes are ABc or Abc
- put together in Punnett square and you get 4 boxes, AABbCc, AAbbCc,
AaBbCc, AabbCc
- now count the number of dominant alleles for this offspring
- 4,3,3,2 are your results so now you graph this in a bar graph
- X-axis is the number of dominant alleles and y-axis is the number of
individuals
find more resources at oneclass.com
find more resources at oneclass.com

II. Multifactorial Traits: Interaction between a single gene or multiple genes
with the environment leads to the phenotype.
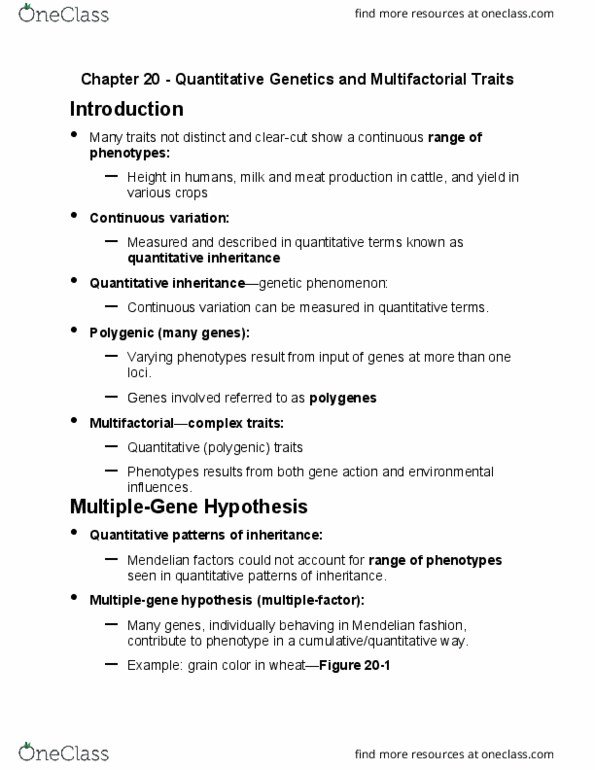
A. Mendelian and Polygenic Multifactorial traits:
- Mendelian is single gene
- Polygenic is more than one gene
- Multifactorial is environment
B. Epigenetics (“on top of genetics”)
- Addition of chemical groups (ex. methyl groups) to the chromatin
- Impacts gene expression
- can have an effect on phenotype
- Supposed to be “washed off” when during reproduction, but some people are
thinking some can be passed
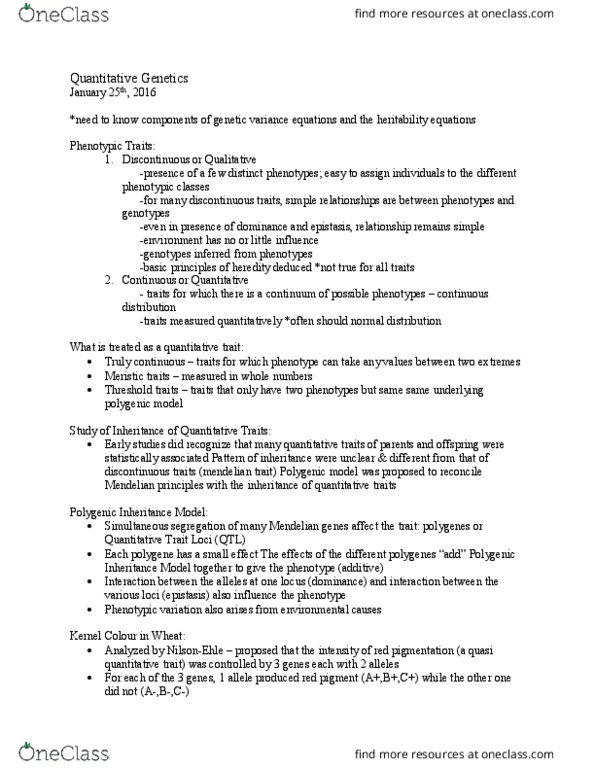
C. Multifactorial Threshold Traits (figure 5.9, table 5.1)
- Polygenic as well, but persons with a genotype above the threshold will
develop the condition… so it is you have it or you don’t, rather than varying
degrees of having it
- Discontinuous distribution in a population
- Relative risk decreases substantially with each degree of separation (via
generations) since there are fewer alleles in common
- Example conditions: heart disease, diabetes, cancer, Parkinson’s, bi-polar,
schizophrenia, sporadic Alzheimer’s, etc.
find more resources at oneclass.com
find more resources at oneclass.com
Document Summary
Lecture #7- inheritance of complex traits (chapter 5 all: polygenic (quantitative) inheritance: when more than one gene contributes to a phenotype, mendelian vs polygenic traits (figure 5. 1) F1 show a phenotype intermediate to that of the parents. F2 show a range of continuously varying phenotypes. Quantitative = measured on a scale of numbers. Need large sample sizes, so it is best to use population data. Population = group of individuals in the same species in the same place at the same time. Not okay to mix different populations in the data: the additive model for polygenic inheritance (handout, figure 5. 5) Each dominant allele contributes an equal and additive amount to the phenotype recessive alleles contribute nothing. Number of dominant alleles on the x-axis. Uses incomplete dominance, which means you can see a difference in the variation of expression based on individuals with more dominant alleles versus less.