CHEM 7L Lecture Notes - Lecture 2: Analyte, Buffer Solution, Gravimetric Analysis

6 Oct 2017
School
Department
Course
Professor
Document Summary
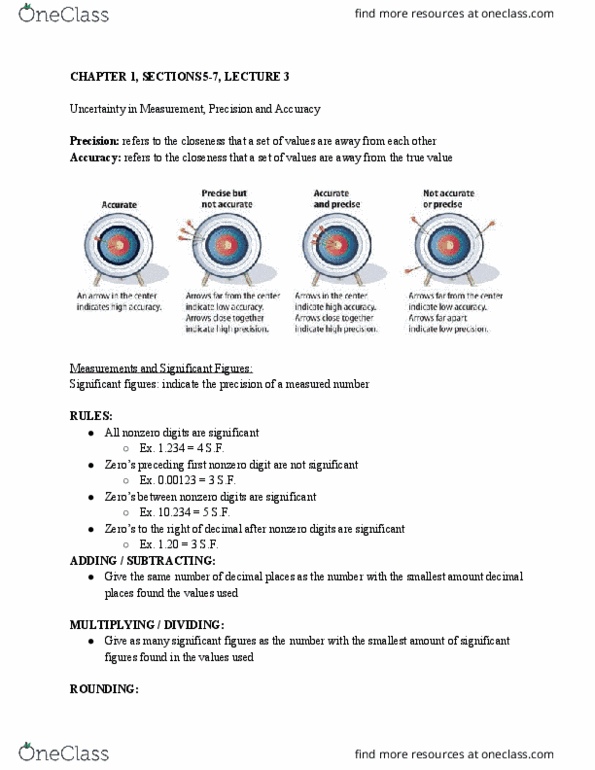
Bring a calculator to lab for the quiz. Lab 1 is due monday, oct 9th at midnight. Random errors are revealed and reduced by repeating sets of measurements, but they can never be completely eliminated. The distribution of replicate data can be described as a gaussian, or normal, curve. Significant figures: all the certain digits plus the first uncertain digit. You can easily tell the liquid is greater than 30. 2 but less than 30. 3. That 4 is your first uncertain digit, so you have 4 significant figures. Disregard all final zeros unless they follow a decimal point. All remaining digits including zeros between nonzero digits are significant. Result should have the same number of decimal places as the number with the smallest number of decimal places when adding or subtracting. Result should have the same number of significant figures as the number with the least amount of sig figs when multiplying or dividing.