STATS 250 Lecture 6: STATS 280 NOTES 9:27


49
STATS 250 Full Course Notes
Verified Note
49 documents
Document Summary
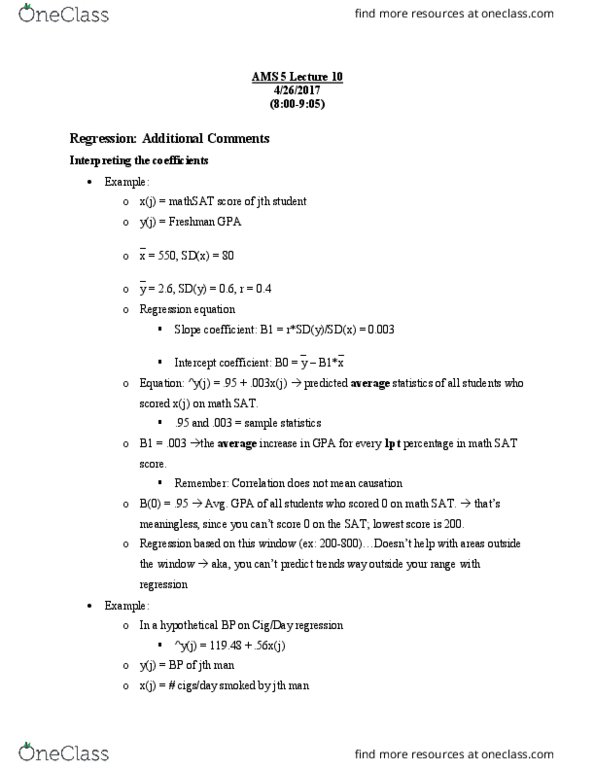
Should know how to subset in r. Not common, but should be known: will go through the point of averages, not the same as the sd line. 165): a university has made a statistical analysis of the relationship between math sat scores and first year gpa. Average gpa = 2. 6 sd = 0. 6 r = 0. 4. Example 2: suppose the percentile rank of one student on the sat is 90%. Method 1: 650 is 1. 25 sds above average, so 1. 25 * 0. 4 = 0. 5. Our best guess is 0. 5 sds above average in y. (2. 6 + 0. 5*0. 6 = 2. 9) (cid:4666)(cid:3025)(cid:4667) = 0. (cid:886) (cid:2868). 68(cid:2868) = 0. 003 (cid:1877)=0. 00(cid:885)(cid:1876)+ (cid:884). (cid:888)=0. 00(cid:885)(cid:4666)(cid:887)(cid:887)0(cid:4667)+ =0. 9(cid:887) (cid:1877)=0. 00(cid:885)(cid:4666)(cid:888)(cid:887)0(cid:4667)+0. 9(cid:887)=(cid:884). 9 rank on first year gpa. (assume data follows the normal curve) Find the z-score where there is 10% on each tail, because z-score finds the percentage in the middle so find 80% on the normal table.