STATS 250 Lecture Notes - Lecture 3: Interquartile Range, Percentile, Unimodality

STATS 250 verified notes
3/41View all
Document Summary
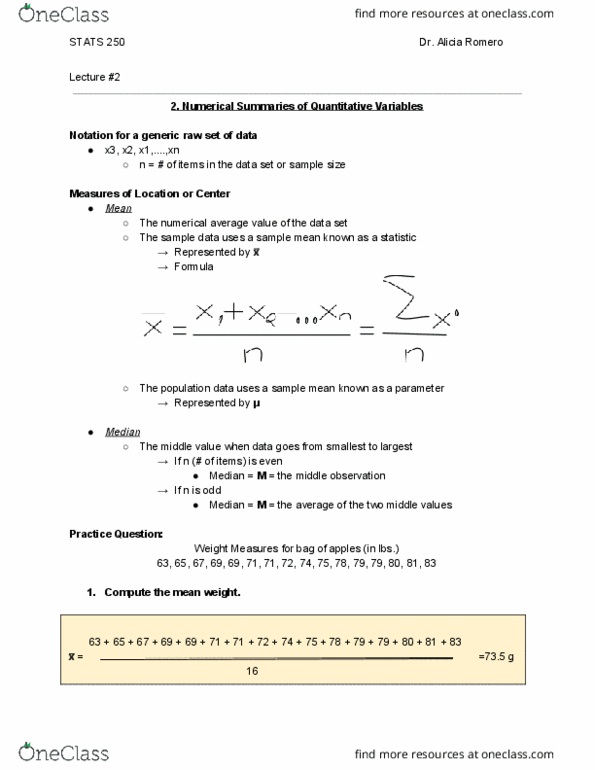
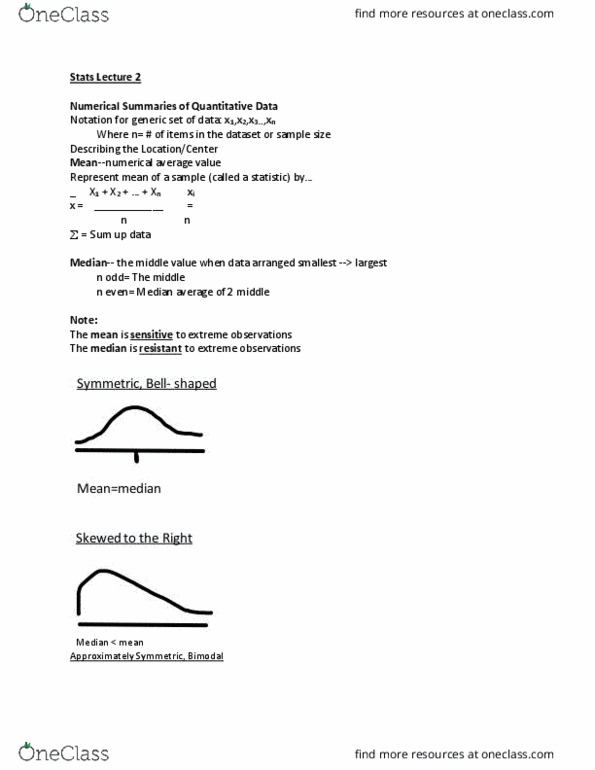
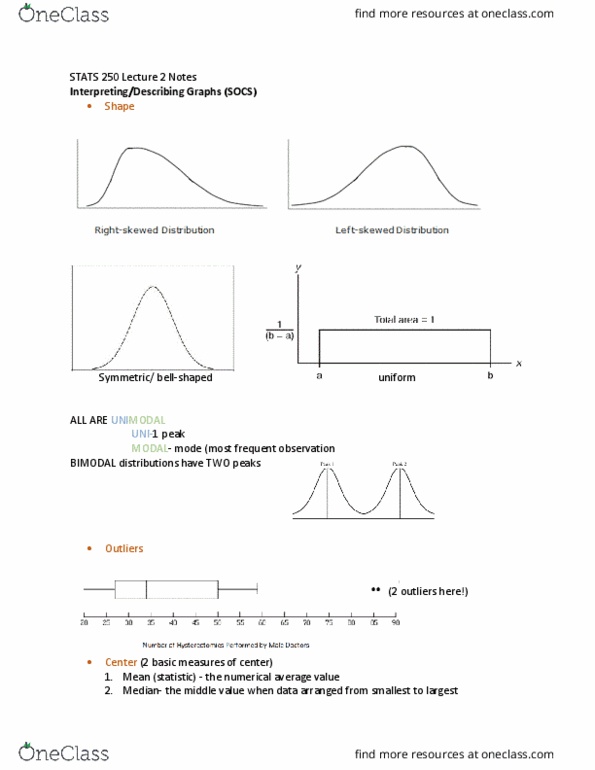
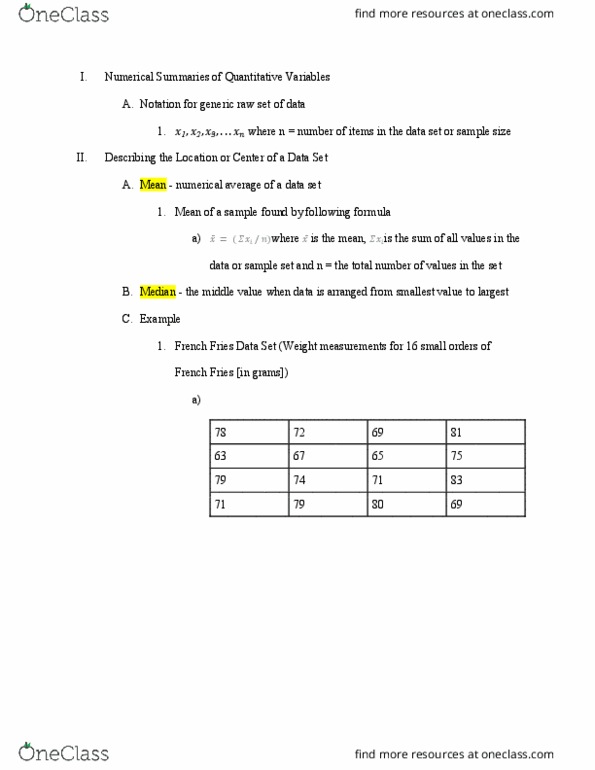
Numerical summaries of quantitative variables, notation for generic raw set of data, 1,2,3, where n = number of items in the data set or sample size. 69: histogram of weights of small french fries by jordy garcia y c n e u q e r. 80 85 (1) based on the histogram, the distribution of the weight is unimodal (only 1 peak) and approximately symmetric (this means computing the numerical summaries is reasonable). =73. 5 (cid:1870)(cid:1865)(cid:1871) (1) first order the median weight (a) 63, 65, 67 69, 69, 71, 71, 72, 74, 75, 78, 79, 79, 80, = 73 grams (i) = 72 + 74. 2 (3) note: the mean is sensitive to outliers; the median is resistant: mean versus median (1) symmetric. Mean and median are equal (2) skewed to the left. Mean < median (3) skewed to the right. Weights of fries in grams (n = 16 orders)