STATS 250 Lecture Notes - Lecture 30: Standard Deviation, Coaltar Of The Deepers, Test Statistic

STATS 250 verified notes
30/41View all
Document Summary
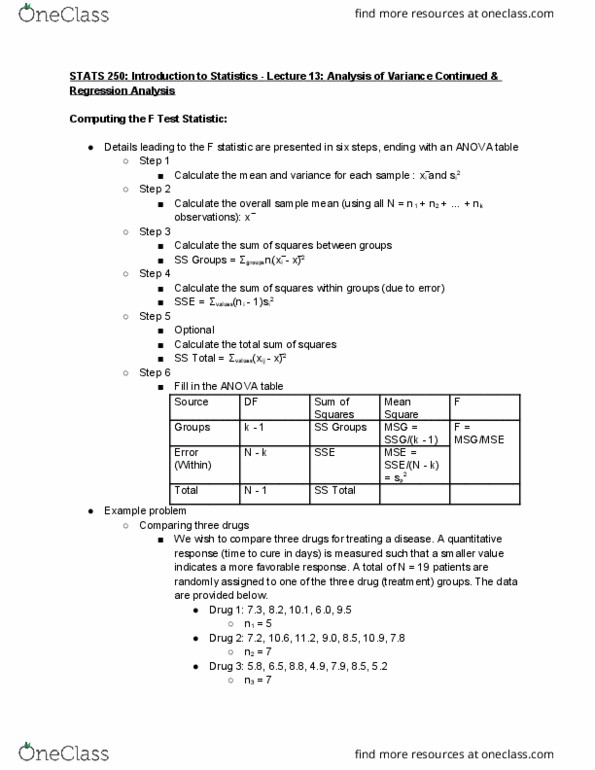
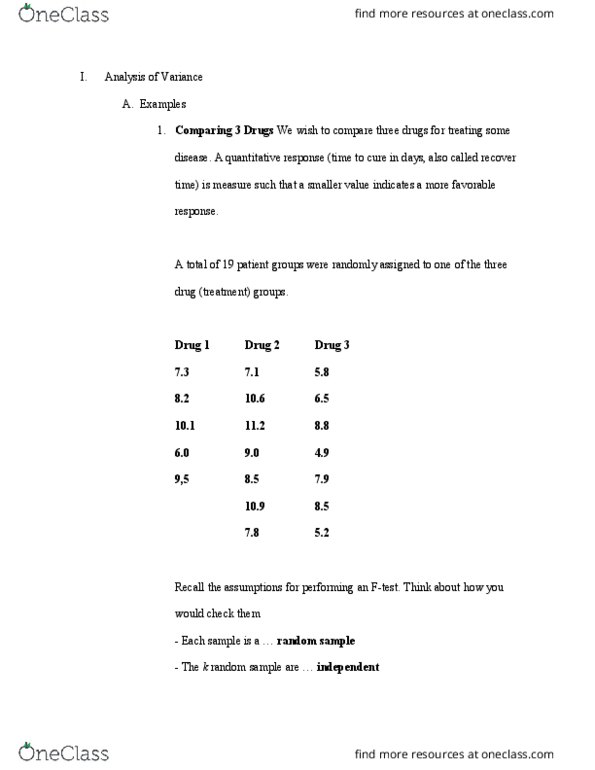
Analysis of variance, examples, comparing 3 drugs we wish to compare three drugs for treating some disease. A quantitative response (time to cure in days, also called recover time) is measure such that a smaller value indicates a more favorable response. A total of 19 patient groups were randomly assigned to one of the three drug (treatment) groups. Each sample is a random sample. The k random sample are independent. For each population the model for response is a normal distribution. The k population variances are equal. Step 1: calculate the mean and variance for each sample. Step 4: calculate the sum of squares within groups (due to error) Step 3: calculate the sum of squares between groups x* = (cid:3036)(cid:4667)2 (cid:4666)1 1(cid:4667)(cid:4666)1 (5 - 1)(2. 74) + (7 - 1)(2. 61) + (7 - 1)(2. 56) = 41. 98. Step 5: optional: calculate the total sum of squares: no thank you! Df sum sq mean sq f value pr (>f)