STATS 250 Lecture Notes - Lecture 14: Null Hypothesis, Scatter Plot, Prediction Interval


49
STATS 250 Full Course Notes
Verified Note
49 documents
Document Summary
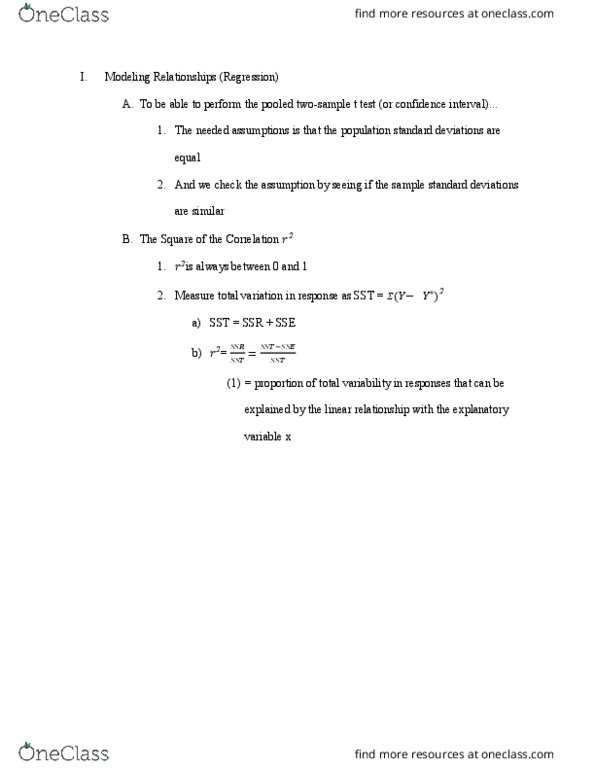
Stats 250: introduction to statistics - lecture 14: regression analysis continued. Always has a value between 0 and 1. Related to the sums of squares that arise in regression. R2 = (ssto - sse)/ssto = ssm/ssto. The proportion of total variability in the responses that can be explained by the linear relationship with the explanatory variable x. The responses (in the example problem from the previous lecture, the amount of tip) in a data set are not all the same- they do vary. The amount of tip varies because there is a linear relationship between amount of tip and amount of bill, and the study included different amounts of bill. Total variation is measured as ssto = (y - y-bar)2 = ssm + sse. When we found the least squares regression line, there was still some small variation remaining of the responses from the line. Sse is the amount of variation that is not accounted for by the linear relationship.