APST 207 Lecture Notes - Lecture 4: Squared Deviations From The Mean, Standard Score

Document Summary
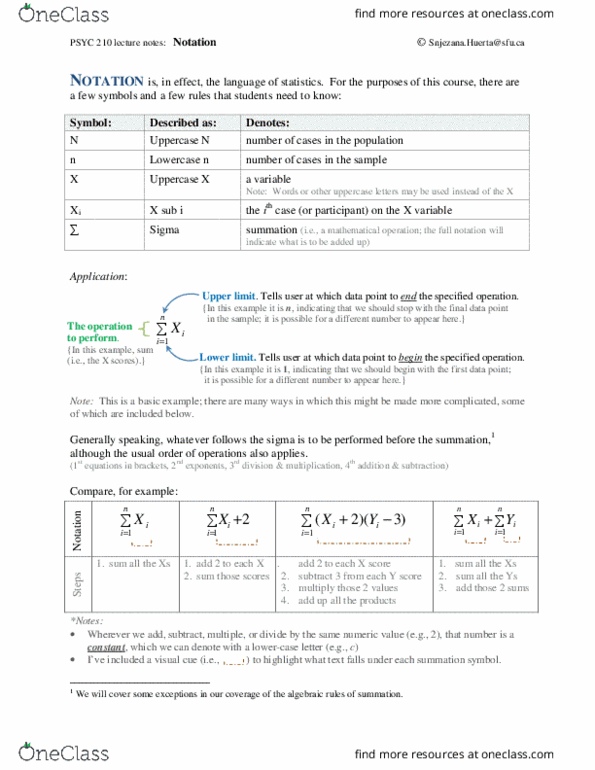
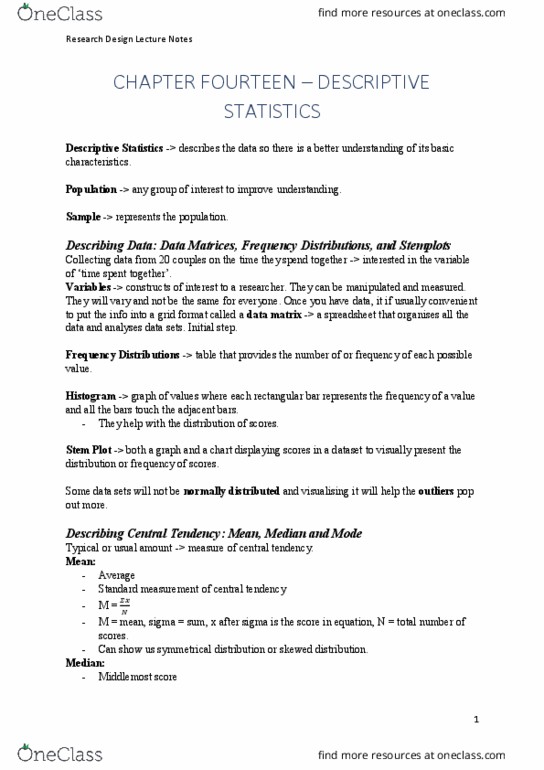
We use symbols in stats to make our lives easier. N- number of cases in a population. N- number of cases in a sample. Means sum everything that comes after the symbol. So xi means add up all the values for x (or all the data points,where x is the variable and i is every single case. Suppose we have these data points: 1,2,2,3,3,3. Mean (average)- the typical value in a dataset. Calculated by summing all values of x in the dataset (we call this x1) and dividing it by the number of cases in the dataset. Range: the largest value minus the smallest value. Cons =: very sensitive to extreme values. Input the data range for both min and max. Variance: how spread out the data is. On average,how much the cases deviate from the mean. Divided by the sample size (n) minus 1 - or- The average of the squared deviations from the mean.