CHE 210 Lecture Notes - Lecture 4: Cauchy Distribution, Dialog Box, Linear Combination

12 Jan 2017
School
Department
Course
Professor
Document Summary
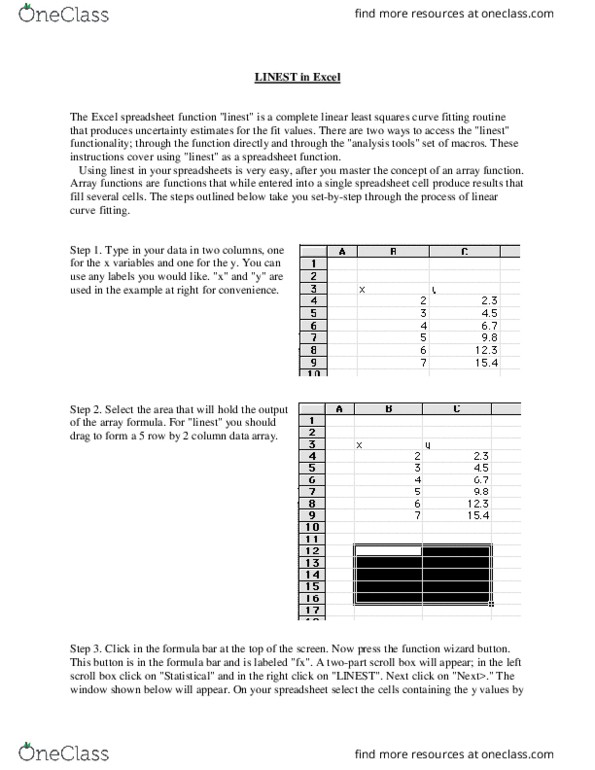
In lab we saw that a lorentzian profile could be fit with the following equation. ( )l x. We used solver to adjust the two constants x 0 and so that the observed data fits the function by minimizing the square of the difference between the observed and calculated values. We had to use solver to do this because the model function is non-linear (explained later) in the two adjustable parameters. Excel can also fit simpler models more directly. If we have a set of data that can be modeled with a straight-line fit, we have two options. The first option is to use the builtin slope(y-values,x-values) and intercept(x-values,y-values) where y-values are the known y observations (a cell range) and the x-values are the known x"s (a cell range). The other option is to plot the data and use the trendline tool to fit the data.