STA 371G Lecture Notes - Lecture 7: Random Variable, Dependent And Independent Variables, Regression Analysis

Document Summary
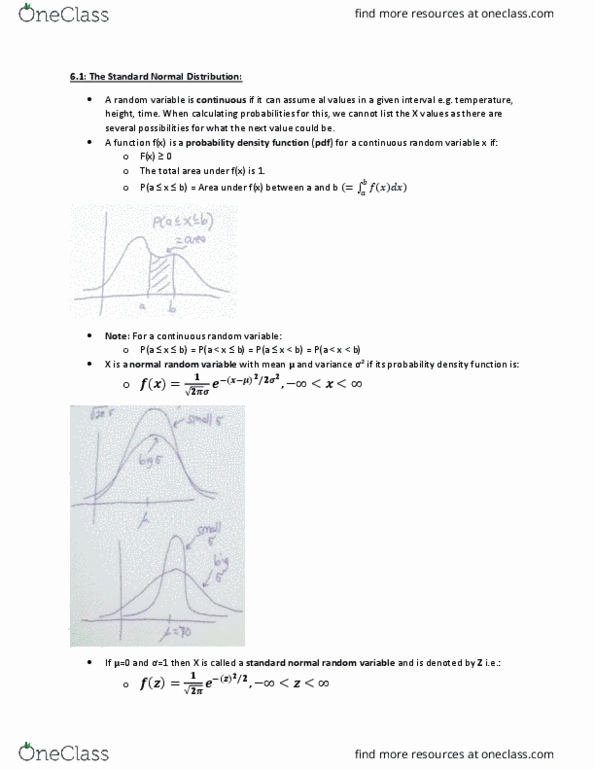
Random variable: # about which we are uncertain, but can describe possible outcomes. Listing all possible values isn"t possible, we have to use intervals: probablility the r. v. falls in interval given by the area under the probability density function. For a continuous r. v. the probability assigned to any single value is zero. Probability density function: area under the curve has to equal 1. Normal distribution: most used probability distribution to describe a continuous random variable. Its probability density function (pdf) is symmetric & bell-shaped: prob the # ends up in an interval is given by the area under the pdf. Standard normal distribution: mean=0, var=1: z ~ n(0,1) means z has the distribution with mean=0 and var=1, p(-1 < z < 1) = 0. 68, p(-1. 96 < z < 1. 96) = 0. 95 can sub 2 for 1. 96. *regression analysis = most widely used statistical tool for understanding relationships among variables: using one set of variables to predict another variable.