STAT 2004 Lecture Notes - Lecture 7: Ap Statistics, Scatter Plot

14 Oct 2018
School
Department
Course
Professor
Document Summary
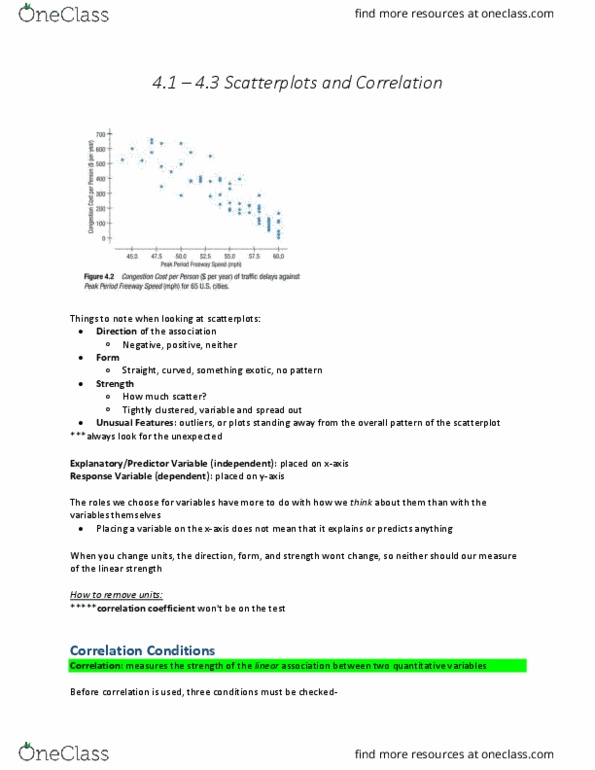
Chapter vii scatter plots, association, & correlation. Most common and most effective way to display data: clearly illustrate trends, patterns, relationships, and extraordinary values, best way to observe quantitative values. Direction: negative scatter plot: the scatter plot pattern runs from the upper left to the lower right, positive scatter plot: the scatter plot pattern runs from the lower right to the upper left. Explanatory/predictor variable: typically placed on the x-axis (independent variable) Response variable: typically placed on the y-axis (dependent variable) Positive association: y-values tend to increase as x-values increase: points farther away from the origin make a scatterplot look more positive. Negative association: values located in the second and fourth quadrants of a scatterplot. Values with z-scores of zero, or points located along an axis, don"t vote either way due to the fact that.