BIOL 204 Lecture 16: biodiversity population lecture notes

3 Dec 2016
School
Department
Course
Professor
Document Summary
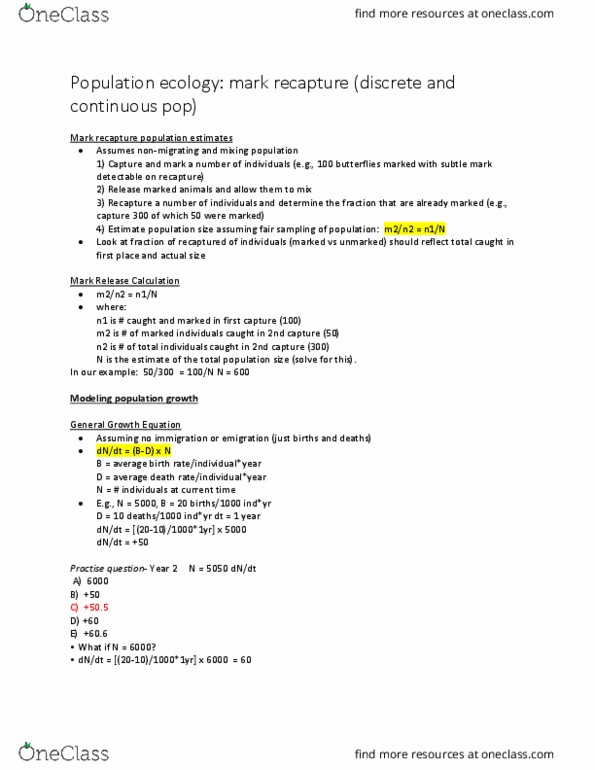
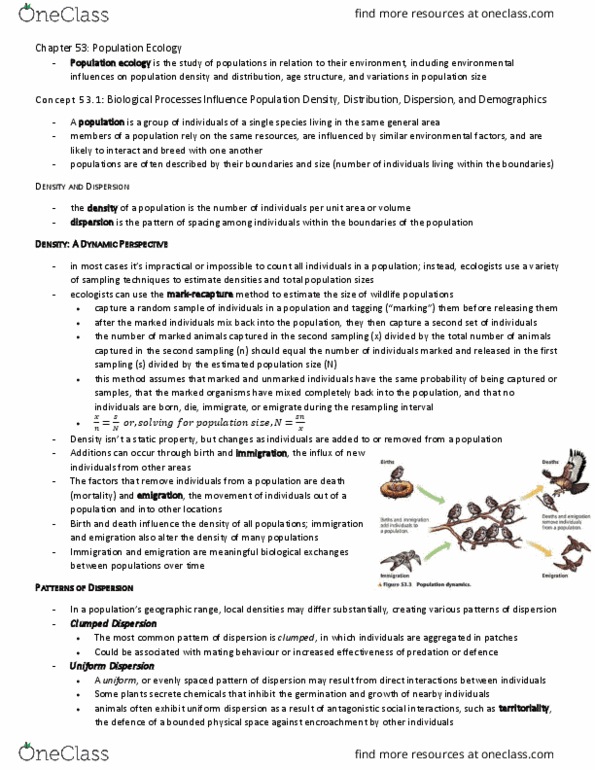
Populations do not change in size during cmr procedure. Marked and unmarked individuals are a random sample of the population. Marking do not impact likelihood of dying before the second capture: m^2/ n^2=n1/n, n=n1n2/m2. M2= number of marked animals in second sample. N2= total number of animals in second sample (marked and unmarked) N1= number of individuals capture in first sample. Age structure- the proportion of individuals in a population that are at each possible age. Various ages/stages have different reproduction and death rates, what they do etc. Age or stage of an organism can greatly impact the probability that the organism will survive to the next step (ex year) or reproduce during that time frame. Ex: elderly not likely to reproduce in next stage, but are likely to die Life table: table that summarizes the probability that an individual in a given age will survive to reproduce.