1
answer
0
watching
382
views
19 Nov 2019
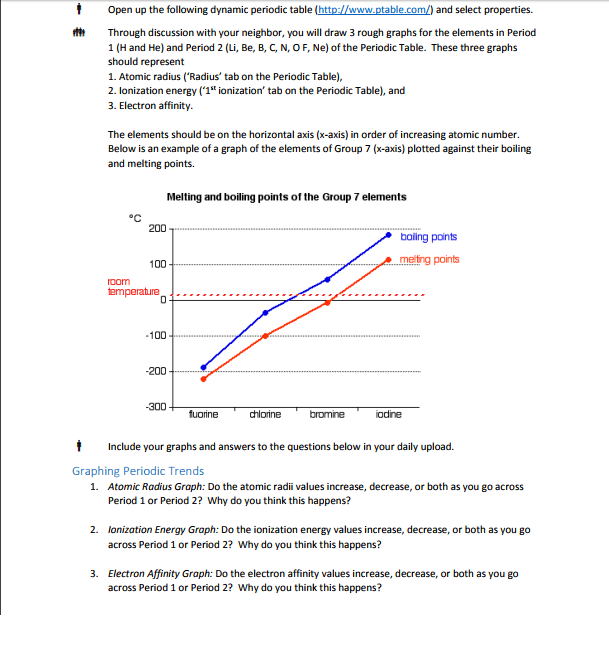
iOpen up the following dynamic periodic table ( ) and select properties. Through discussion with your neighbor, you will draw 3 rough graphs for the elements in Period 1 (H and He) and Period 2 (Li, Be, B, C, N, O F, Ne) of the Periodic Table. These three graphs should represent 1. Atomic radius ('Radius' tab on the Periodic Table), 2. lonization energy ('1st ionization' tab on the Periodic Table), and 3. Electron affinity. The elements should be on the horizontal axis (x-axis) in order of increasing atomic number Below is an example of a graph of the elements of Group 7 (x-axis) plotted against their boiling and melting points. Melting and boiling points of the Group 7 elements eC 200 boing points 100 .meltng points oom emperatune 200 300 uoine chlorine bromine odine iInclude your graphs and answers to the questions below in your daily upload. Graphing Periodic Trends 1. Atomic Radius Graph: Do the atomic radii values increase, decrease, or both as you go across Period 1 or Period 2? Why do you think this happens? 2. lonization Energy Graph: Do the ionization energy values increase, decrease, or both as you go across Period 1 or Period 2? Why do you think this happens? 3. Electron Affinity Graph: Do the electron affinity values increase, decrease, or both as you go across Period 1 or Period 2? Why do you think this happens?
Tod ThielLv2
11 Sep 2019