8
answers
0
watching
167
views
5 Oct 2018
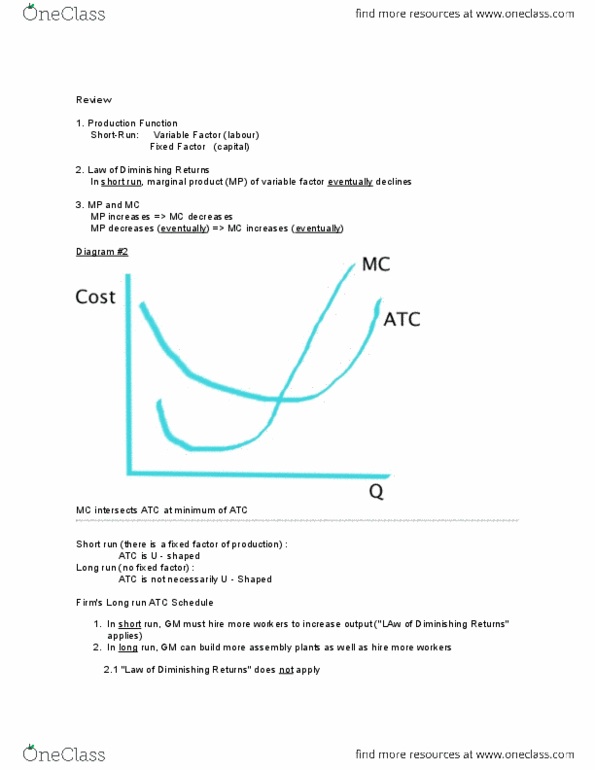
Use the figure below to answer the following questions. Average cost (dellars per teapot LRAC Output (teapots per day) Figure 11.4.4 22) Refer to Figure 11.4.4, which illustrates the long-run average total cost curve. Which one of the following statements isfalse? A) Economies of scale exist between 0 and Qo units of output. B) Diseconomies of scale exist between 0 and Q1 units of output. ) Constant retums to scale exist between Qo and Q1 units of output D) Constant returns to scale exist between Q1 and Q2 units of output. E) Diseconomies of scale exist at quantities greater than Q2 units of output.
Use the figure below to answer the following questions. Average cost (dellars per teapot LRAC Output (teapots per day) Figure 11.4.4 22) Refer to Figure 11.4.4, which illustrates the long-run average total cost curve. Which one of the following statements isfalse? A) Economies of scale exist between 0 and Qo units of output. B) Diseconomies of scale exist between 0 and Q1 units of output. ) Constant retums to scale exist between Qo and Q1 units of output D) Constant returns to scale exist between Q1 and Q2 units of output. E) Diseconomies of scale exist at quantities greater than Q2 units of output.

akunuru639Lv10
28 May 2023


larryrambo777Lv10
19 Mar 2023
Already have an account? Log in

Tod ThielLv2
7 Oct 2018
Already have an account? Log in