12
answers
0
watching
521
views
16 Dec 2017
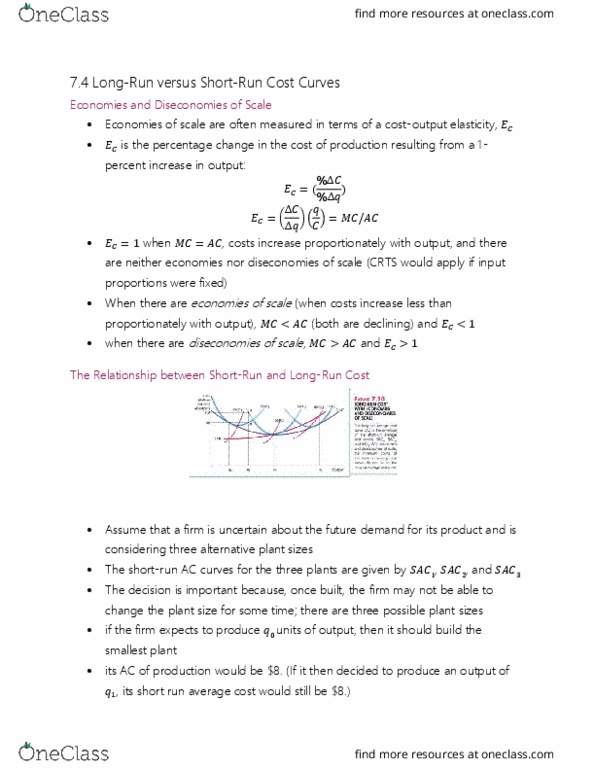
The figure below shows a family of cost curves for a firm. The subscripts 1, 2, and 3 for the SRATC curves refer to different plant sizes. LRAC SRATC3 SRATC2 SRATC Cost < D E 01 02 03 04 05 Output FIGURE 8-3 29) Refer to Figure 8-3. If this firm is producing at point B, then A) this firm is producing a level of output that is technically inefficient in the long run. B) this firm is experiencing decreasing returns to scale. C) this firm could produce the same level of output at a lower cost with plant size 2. D) it should employ more of its variable factors of production. E) plant size 1 is optimal.
The figure below shows a family of cost curves for a firm. The subscripts 1, 2, and 3 for the SRATC curves refer to different plant sizes. LRAC SRATC3 SRATC2 SRATC Cost < D E 01 02 03 04 05 Output FIGURE 8-3 29) Refer to Figure 8-3. If this firm is producing at point B, then A) this firm is producing a level of output that is technically inefficient in the long run. B) this firm is experiencing decreasing returns to scale. C) this firm could produce the same level of output at a lower cost with plant size 2. D) it should employ more of its variable factors of production. E) plant size 1 is optimal.

larryrambo777Lv10
8 Mar 2023

18 Dec 2022
Already have an account? Log in


experttutorLv10
4 Dec 2022
Already have an account? Log in

glorysoft2Lv10
25 Sep 2022
Already have an account? Log in

learn4lifeLv10
5 Jul 2022
Already have an account? Log in


teacherrecoLv10
5 Jul 2022
Already have an account? Log in


Jean KeelingLv2
18 Dec 2017
Already have an account? Log in