Homework Help for Statistics

5,736 results

Statistics is an area of Mathematics that uses large amounts of numerical data to make inferences based on probabilities.

For unlimited access to Homework Help, a Homework+ subscription is required.

Avatar image
almas8 answered this question
Avatar image
almas8 answered this question
Avatar image
almas8 answered this question
in Statistics·
26 Mar 2022

18. Suppose that the vehicle speeds at an interstate location have a normal distribution with a mean equal to 70mph and a standard deviation equal to 8mph. What is the z-score for a speed of 68mph? (2 points)  
A.z=−0.35z=−0.35       B.z=−0.55z=−0.55       C.z=−0.25z=−0.25       D.z=−0.45z=−0.45  19.

The time it takes for Grade 11 students in a certain school to complete a physical fitness test is normally distributed with a mean of 15 minutes and a standard deviation of 4 minutes. If the students who get the fastest 10% completion times will be exempted from the additional gym workout sessions, what is the slowest time for a student to qualify for the exemption? (2 points)

A. 9.88 minutes           B.18.36 minutes          C.8.42 minutes          D.11.64 minutes        

20. Which of the following statements about the normal curve is FALSE?

A.The normal distribution is a continuous random probability distribution.

B. The standard normal distribution is unimodal. 

C. The total area under the normal distribution is one. 

D. All variables that are approximately normally distributed can be transformed into  normal variables.  21. Let z1=−1.80z1=−1.80 and  z2=−0.25z2=−0.25. Which among the following probabilities for z-score illustrates the area under the standard normal curve as shown at the right using  z1z1and z2z2 ?


A.P(−1.80<z<−0.25)P(−1.80<z<−0.25)  B.P(z>−0.25)P(z>−0.25)  C.P(−1.80>z<−0.25)P(−1.80>z<−0.25)  D.P(z>−1.80)P(z>−1.80)    22.Terence's scores in Mathematics this semester were rather inconsistent. His scores are as follows: 55, 100, 95, 85, 75, 100. How many scores are within one standard deviation of the mean? (2 points)
A.5     B.6     C.3     D.4 

23. Which is TRUE about the negative z- score?

A. A negative z-score means that the student’s score surpassed more than 50% of his classmates.
B. A negative z-score implies that the students scored higher than the class mean.

C. A negative z-score means that the student’s score is lower than the median. 
D. A negative z-score means that the student’s score is located at the right side of the curve. 

24. Find the area under the standard normal curve between z = 0 and z = – 1.05.
A. 0.1469

B. 0.4332 
C. 0.3531 
D.0.0668


Avatar image
almas8 answered this question
in Statistics·
26 Mar 2022

18. Suppose that the vehicle speeds at an interstate location have a normal distribution with a mean equal to 70mph and a standard deviation equal to 8mph. What is the z-score for a speed of 68mph? (2 points)  
A.z=−0.35z=−0.35       B.z=−0.55z=−0.55       C.z=−0.25z=−0.25      D.z=−0.45z=−0.45 

19. The time it takes for Grade 11 students in a certain school to complete a physical fitness test is normally distributed with a mean of 15 minutes and a standard deviation of 4 minutes. If the students who get the fastest 10% completion times will be exempted from the additional gym workout sessions, what is the slowest time for a student to qualify for the exemption? (2 points)

A.9.88 minutes           B.18.36 minutes          C.8.42 minutes               D.11.64 minutes        

20. Which of the following statements about the normal curve is FALSE?

A. The normal distribution is a continuous random probability distribution.

B. The standard normal distribution is unimodal. 

C. The total area under the normal distribution is one. 

D. All variables that are approximately normally distributed can be transformed into  normal variables.  21. Let z1=−1.80z1=−1.80 and  z2=−0.25z2=−0.25. Which among the following probabilities for z-score illustrates the area under the standard normal curve as shown at the right using  z1z1and z2z2 ?


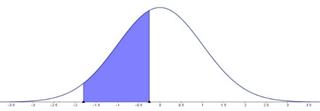
A. P(−1.80<z<−0.25)P(−1.80<z<−0.25)       B. P(z>−0.25)P(z>−0.25)       C. P(−1.80>z<−0.25)P(−1.80>z<−0.25)       D. P(z>−1.80)P(z>−1.80)  22.

Terence's scores in Mathematics this semester were rather inconsistent. His scores are as follows: 55, 100, 95, 85, 75, 100. How many scores are within one standard deviation of the mean? (2 points)

A.5      B.6      C.3      D.4 

23. Which is TRUE about the negative z- score?

A. A negative z-score means that the student’s score surpassed more than 50% of his classmates.

B. A negative z-score implies that the students scored higher than the class mean. 

C. A negative z-score means that the student’s score is lower than the median. 

D. A negative z-score means that the student’s score is located at the right side of the curve. 


24. Find the area under the standard normal curve between z = 0 and z = – 1.05.

A. 0.1469

B. 0.4332 

C. 0.3531 

D. 0.0668

Avatar image
almas8 answered this question
Avatar image
almas8 answered this question
Avatar image
almas8 answered this question
Avatar image
almas8 answered this question
Avatar image
versean2001 asked for the first time
Avatar image
almas8 answered this question
Avatar image
almas8 and 1 tagged contributor answered this question
in Statistics·
16 Mar 2022

10. What is the best point estimate of the GWA of all senior high school students?
      A. 85 B. 87 C. 88 D. 89
11. At 99% confidence level, what is the confidence coefficient to be used?
      A. 1.282 B. 1.645 C. 1.96 D. 2.575
12. At 99% confidence level, what is the estimated standard error of the mean? (2 points)
      A. 0.2521 B. 0.2551 C. 0.2567 D. 0.2732
13. At 99% confidence level, what is the margin of error to estimate the GWA of all senior 
high school students? (2 points)
      A. 0.3291 B. 0.4223 C. 0.6610 D. 0.6613
14. At 99% confidence level, what is the interval estimate of the GWA of all senior high 
school students?
      A. 87.3556 - 88.6776 C. 87.5777 - 88.4223
      B. 87.4969 - 88.5031 D. 87.6709 - 88.3291
15. At 95% confidence level, what is the confidence coefficient to be used?
      A. 1.282 B. 1.645 C. 1.96 D. 2.576
16. At 95% confidence level, what is the estimated standard error? (2 points)
      A. 0.2521 B. 0.2551 C. 0.2567 D. 0.2732
17. At 95% confidence level, what is the margin of error to estimate the GWA of all senior 
high school students? (2 points)
      A. 0.3291 B. 0.4223 C. 0.5031 D. 0.6613
18. At 95% confidence level, what is the interval estimate of the GWA of all senior high 
school students?
      A. 87.3387 - 88.6613 C. 87.5777 - 88.4223
      B. 87.5135 - 88.5197 D. 87.6709 - 88.3291
For items 19-21, In preparation for the next school year, the school administrator wants to 
estimate the GWA. If they want to estimate the GWA accurate within an error of 0.75 from 
its true value,
19. What is the estimated population standard deviation?
      A. 2.93 B. 3.33 C. 3.43 D. 3.45
20. What should be the sample size at 99% confidence level? (2 points)
      A. 141 B. 200 D. 375 D. 425
21. What should be the sample size at 95% confidence level? (2 points)
      A. 65 B. 82 D. 92 D. 104


                            Students experience tremendous levels of stress throughout their education. A high level of stress may have a negative effect on the cognitive functioning and learning of students. The school administration of CSU - Laboratory High School - Senior High (CSU-LHS-SH) sought to determine the levels and primary sources of stress and its possible correlation with the General Weighted Average (GWA) in its department. As a statistician, your task is to conduct hypothesis testing to analyze the gathered data. Data were collected from students of CSU-LHS-SH during the first semester of the academic year 2021 - 2022.. The Student Stressor Questionnaire (SSQ) was used to collect the data.
            The SSQ contains 20 items that cover six subscales: (Academic-Related Stressors (ARS), Intrapersonal and Interpersonal Related Stressors (IRS), Learning-Related Stressors (LRS), Social-Related Stressors (SRS), Drive- and Desire-Related Stressors (DRS), and Group Activity-Related Stressors (GARS). Items in the SSQ represent 20 events that might be sources of stress (eg, “lack of time to review what has been learnt”, “heavy workload”). The responses were measured on a four-point Likert scale: “0=causing no stress”, “1=causing mild stress”, “2=causing high stress”, or “3=causing severe stress”.
            The findings of this study will contribute to the educational literature on the effect of stress on students’ academic performance, thus it must be accurate and timely.                                         No. STRAND MODALITY GWA ARS IRS LRS SRS DRS GARS                     1 ABM OBL 90 1 0 1 0 0 2 2 STEM OBL 90 2 0 2 1 0 1 3 STEM CBL 87 1 1 1 1 2 2 4 STEM OBL 90 1 0 1 0 1 1 5 STEM OBL 91 1 1 0 0 2 1 6 ABM CBL 90 1 0 1 1 0 1 7 STEM OBL 94 2 1 1 0 0 1 8 STEM OBL 93 2 0 2 1 0 1 9 ABM OBL 89 1 0 1 0 1 1 10 STEM CBL 87 2 2 1 1 2 2 11 ABM CBL 87 2 1 1 1 1 2 12 ABM OBL 89 2 0 1 0 0 2 13 ABM OBL 89 1 0 1 2 1 1 14 ABM CBL 83 3 2 3 2 3 3 15 STEM OBL 95 0 0 0 0 0 1 16 HUMSS OBL 90 1 0 1 1 0 1 17 HUMSS OBL 89 1 1 1 0 0 3 18 HUMSS OBL 89 1 0 1 1 1 1 19 STEM OBL 89 0 0 1 1 2 2 20 HUMSS CBL 90 1 0 1 2 0 1 21 HUMSS OBL 92 0 0 0 0 1 2 22 HUMSS CBL 84 3 2 2 1 3 2 23 HUMSS CBL 86 2 2 2 2 2 2 24 HUMSS OBL 90 1 0 1 0 1 1 25 STEM CBL 93 1 0 0 0 0 2 26 STEM CBL 95 1 0 1 0 1 2 27 STEM CBL 87 3 1 3 1 2 1 28 STEM OBL 94 0 1 0 1 0 0 29 HUMSS OBL 85 3 1 2 2 2 3 30 STEM OBL 88 2 0 1 0 1 3 31 ABM CBL 80 3 2 3 3 3 3 32 STEM OBL 88 3 0 1 0 1 2 33 HUMSS CBL 83 3 2 3 2 3 2 34 STEM OBL 88 2 1 1 1 1 2 35 ABM OBL 88 2 0 1 0 1 2 36 STEM CBL 85 3 1 3 2 2 2 37 STEM CBL 80 3 3 3 3 3 3 38 STEM CBL 82 3 3 3 2 3 3 39 STEM OBL 87 3 1 1 1 3 2 40 STEM OBL 88 2 0 1 0 0 2 41 STEM CBL 86 1 1 1 2 2 2 42 STEM OBL 92 1 1 0 1 0 1 43 HUMSS CBL 87 2 2 1 0 2 3 44 ABM OBL 90 2 1 0 0 1 1 45 STEM OBL 93 0 1 0 0 1 1 46 STEM OBL 92 1 1 0 0 0 2 47 STEM CBL 84 2 2 2 2 3 3 48 STEM CBL 84 3 3 2 2 3 3 49 ABM OBL 85 3 1 2 2 2 2 50 ABM CBL 86 2 1 1 2 2 2 51 STEM OBL 91 0 0 1 0 0 3 52 HUMSS CBL 82 3 3 3 3 3 3 53 HUMSS CBL 80 3 3 3 3 3 3 54 ABM OBL 85 3 1 2 2 2 2 55 STEM OBL 88 2 0 2 0 1 1 56 STEM OBL 87 2 1 1 1 2 1 57 STEM CBL 84 3 2 3 3 2 2 58 STEM OBL 91 1 0 0 1 0 3 59 ABM CBL 81 3 3 3 2 2 3 60 ABM OBL 90 1 0 1 0 0 1 61 ABM OBL 87 2 1 1 0 2 2 62 ABM OBL 87 2 1 1 1 2 2 63 STEM OBL 85 3 1 2 2 2 2 64 STEM OBL 86 2 1 1 2 2 2 65 ABM OBL 86 2 1 3 2 2 2 66 ABM OBL 93 0 0 1 0 0 1 67 STEM CBL 87 2 0 1 1 2 2 68 STEM OBL 88 1 2 1 2 1 3 69 ABM OBL 89 0 1 2 0 0 1 70 ABM OBL 89 1 0 1 0 1 1 71 STEM OBL 91 2 0 2 0 0 1 72 STEM CBL 85 1 1 2 2 2 3 73 HUMSS OBL 93 1 0 2 0 0 1 74 STEM CBL 89 1 0 1 0 1 2 75 STEM OBL 86 2 1 1 2 2 2 76 STEM OBL 85 3 1 3 2 2 3 77 HUMSS OBL 85 2 1 2 2 3 2 78 STEM OBL 91 1 0 0 0 1 1 79 STEM OBL 86 2 1 1 2 2 2 80 STEM CBL 83 2 1 3 2 3 3 81 STEM OBL 94 0 1 0 0 0 1 82 ABM CBL 82 3 2 3 2 3 3 83 STEM OBL 89 1 1 1 0 1 1 84 ABM OBL 86 2 2 1 1 2 2 85 STEM OBL 87 2 1 2 0 2 2 86 STEM CBL 83 3 2 3 2 3 3 87 STEM OBL 85 2 1 2 2 2 2 88 STEM OBL 88 2 0 1 0 1 2 89 STEM CBL 85 3 2 2 2 2 2 90 STEM OBL 88 2 0 1 0 1 2 91 ABM OBL 94 0 1 0 1 0 1 92 ABM OBL 85 3 0 1 2 2 2 93 ABM CBL 88 2 0 2 0 1 2 94 STEM CBL 86 2 1 1 2 2 2 95 STEM OBL 85 3 2 2 1 3 2 96 STEM OBL 86 2 2 1 2 2 2 97 STEM OBL 85 3 1 2 2 2 2 98 STEM OBL 92 1 0 1 0 0 2 99 ABM CBL 90 0 1 2 0 1 3 100 STEM CBL 81 3 3 3 2 3 3 101 HUMSS OBL 89 1 0 2 0 1 1 102 STEM CBL 88 3 0 1 0 1 0 103 HUMSS CBL 85 3 2 3 2 2 2 104 STEM OBL 89 0 0 2 0 1 1 105 STEM OBL 87 2 2 1 1 1 3 106 STEM OBL 89 1 0 1 1 1 1 107 STEM OBL 95 1 0 0 0 1 0 108 HUMSS CBL 84 3 2 2 2 3 3 109 STEM CBL 81 3 3 3 2 2 1 110 STEM OBL 86 2 1 0 2 2 3 111 STEM OBL 89 1 1 1 0 1 1 112 STEM OBL 91 1 0 0 0 0 1 113 STEM OBL 91 1 1 0 0 0 1 114 STEM CBL 89 1 1 0 0 1 1 115 STEM CBL 83 3 2 3 2 3 3 116 STEM OBL 91 3 0 0 0 0 1 117 STEM OBL 95 1 0 1 0 0 1 118 STEM OBL 87 1 1 1 2 2 2 119 STEM OBL 87 2 1 1 1 2 2 120 STEM OBL 89 0 0 1 0 1 3 121 STEM OBL 88 1 0 0 1 1 2 122 STEM OBL 91 1 0 0 1 0 2 123 STEM OBL 92 0 0 0 1 0 3 124 ABM CBL 84 3 2 2 2 3 3 125 STEM OBL 84 3 3 2 2 3 3 126 STEM CBL 83 3 1 3 2 3 3 127 STEM CBL 88 2 0 1 0 1 2 128 STEM OBL 92 1 0 0 1 1 2 129 STEM OBL 85 3 1 2 2 2 2 130 STEM CBL 87 2 1 0 1 2 2 131 STEM OBL 91 0 0 2 0 1 1 132 STEM OBL 88 2 1 0 0 1 3 133 STEM OBL 89 1 0 1 0 1 1 134 STEM CBL 88 2 2 1 2 1 2 135 STEM CBL 82 3 2 3 3 3 3 136 STEM OBL 88 2 0 1 0 1 2 137 HUMSS OBL 89 1 0 1 0 1 2 138 STEM OBL 92 1 0 0 0 0 1 139 ABM OBL 92 0 1 1 0 0 1 140 STEM OBL 92 0 0 1 0 1 1 141 ABM OBL 84 3 2 2 2 3 3 142 ABM OBL 88 1 0 2 0 0 3 143 HUMSS OBL 88 2 1 1 1 1 1 144 STEM OBL 90 1 0 1 0 0 1 145 HUMSS OBL 90 0 1 1 0 0 2 146 HUMSS OBL 90 1 0 1 0 0 1 147 STEM OBL 89 1 0 1 0 1 1 148 HUMSS OBL 94 0 0 0 1 0 2 149 STEM OBL 86 2 1 1 2 2 2 150 STEM OBL 90 0 1 1 0 1 2 151 ABM OBL 86 3 1 1 2 2 2 152 STEM OBL 86 3 1 1 2 2 2 153 STEM OBL 92 0 1 0 0 0 2 154 STEM OBL 90 1 0 2 1 0 1 155 STEM OBL 92 1 1 1 1 1 1 156 HUMSS OBL 86 3 1 2 2 2 3 157 STEM OBL 93 1 0 1 0 0 2 158 ABM OBL 86 2 1 1 2 2 2 159 ABM OBL 91 2 2 0 0 0 1 160 ABM OBL 93 2 0 1 0 0 1 161 ABM OBL 87 1 1 1 2 1 3 162 ABM OBL 87 2 0 1 1 2 2 163 ABM OBL 95 0 1 1 0 0 2 164 ABM OBL 86 2 1 1 2 2 2 165 STEM OBL 91 1 0 0 0 0 1 166 ABM OBL 87 2 1 1 1 2 1 167 ABM OBL 88 2 0 1 0 1 2 168 ABM OBL 93 0 1 0 1 0 2 169 HUMSS OBL 87 2 1 0 1 2 2 170 HUMSS OBL 84 3 2 2 2 3 3 171 HUMSS OBL 93 1 1 0 0 0 1 172 STEM OBL 84 3 2 2 2 3 3 173 STEM OBL 92 1 1 0 0 0 2 174 ABM OBL 83 3 2 3 2 3 3 175 HUMSS OBL 94 1 0 0 0 1 1 176 ABM OBL 91 1 0 1 0 0 1 177 HUMSS OBL 85 3 1 2 1 2 2 178 ABM OBL 86 2 1 1 2 1 2 179 STEM OBL 90 1 0 1 0 2 2 180 STEM OBL 84 3 2 2 1 3 3 181 STEM OBL 88 2 0 1 1 2 2

Avatar image
almas8 answered this question
in Statistics·
16 Mar 2022

10. What is the best point estimate of the GWA of all senior high school students?
      A. 85 B. 87 C. 88 D. 89
11. At 99% confidence level, what is the confidence coefficient to be used?
      A. 1.282 B. 1.645 C. 1.96 D. 2.575
12. At 99% confidence level, what is the estimated standard error of the mean? (2 points)
      A. 0.2521 B. 0.2551 C. 0.2567 D. 0.2732
13. At 99% confidence level, what is the margin of error to estimate the GWA of all senior 
high school students? (2 points)
      A. 0.3291 B. 0.4223 C. 0.6610 D. 0.6613
14. At 99% confidence level, what is the interval estimate of the GWA of all senior high 
school students?
      A. 87.3556 - 88.6776 C. 87.5777 - 88.4223
      B. 87.4969 - 88.5031 D. 87.6709 - 88.3291
15. At 95% confidence level, what is the confidence coefficient to be used?
      A. 1.282 B. 1.645 C. 1.96 D. 2.576
16. At 95% confidence level, what is the estimated standard error? (2 points)
      A. 0.2521 B. 0.2551 C. 0.2567 D. 0.2732
17. At 95% confidence level, what is the margin of error to estimate the GWA of all senior 
high school students? (2 points)
      A. 0.3291 B. 0.4223 C. 0.5031 D. 0.6613
18. At 95% confidence level, what is the interval estimate of the GWA of all senior high 
school students?
      A. 87.3387 - 88.6613 C. 87.5777 - 88.4223
      B. 87.5135 - 88.5197 D. 87.6709 - 88.3291
For items 19-21, In preparation for the next school year, the school administrator wants to 
estimate the GWA. If they want to estimate the GWA accurate within an error of 0.75 from 
its true value,
19. What is the estimated population standard deviation?
      A. 2.93 B. 3.33 C. 3.43 D. 3.45
20. What should be the sample size at 99% confidence level? (2 points)
      A. 141 B. 200 D. 375 D. 425
21. What should be the sample size at 95% confidence level? (2 points)
      A. 65 B. 82 D. 92 D. 104


Start filling in the gaps now
Log in